


Hello my friend,
We have spent some time on configuration of the network functions using NETCONF/YANG using native vendor models and OpenConfig. Now the time is come to talk about information, which we can extract from the router in YANG data models, what is also called model-driven telemetry.
1 2 3 4 5 | No part of this blogpost could be reproduced, stored in a<br> retrieval system, or transmitted in any form or by any<br> means, electronic, mechanical or photocopying, recording,<br> or otherwise, for commercial purposes without the<br> prior permission of the author.<br> |
Brief description
Nowadays telemetry is a hot topic for discussion on various network events, conferences or just vendors’ presentation to customers. As usual, without knowing the details about what it is, how it could be used and which benefit it can bring you, such discussions aren’t more than just a hype. So in this article we’ll try to discovery what telemetry means, for sure, with examples in multivendor environment with Cisco IOS XR and Nokia (Alcatel-Lucent) SR OS.
For a long time, SNMP was the primary source of the information about state of the network. It has evolved a lot since its first release and current version 3 has even built-in security using encryption and hashing. Nevertheless, not all the information about network devices are available through SNMP, that’s why still some information is gathered through show commands and proper parsing, which isn’t flexible task. On the other hand, new era of networking, where SDN comes at the scene, requires much more information from the network about its actual state; this is information must be available to SDN controller or network analytics instantly on anytime basis.
And that’s where model-driven telemetry could help a lot. Model-driven means that telemetry is based on the YANG modules, which are complementary to configuration modules we have used a lot previously. It means that virtually all information about network states should be available through operational YANG modules
As you’ve already learned, there are different types of YANG modules available: vendor-native and vendor-neutral (like OpenConfig). In this article we’ll focus on the vendor-native modules for Cisco IOS XR and Nokia (Alcatel-Lucent) SR OS, as it’s the first natural step in telemetry. In the following articles we’ll review telemetry available in OpenConfig YANG modules as well.
In terms of transport protocol, which is used for model-driven telemetry, there are different options. The most popular deployment is based on gRPC (or recently gNMI), which uses HTTP and perfectly fits for transmission of the structured data. There is another option, which is to use TCP directly, but if we speak about cross-vendor implementation, gRPC/gNMI looks more favorable.
Nevertheless, in our examples you will see some NETCONF, though NETCONF itself isn’t supposed to be transport for telemetry. The reason for that is that we don’t build any telemetry collector yet, but rather focusing on the data collecting itself. Probably we’ll review the streaming of telemetry data in the upcoming articles.
What are we going to test?
We are going to collect information from the network functions in their native YANG modules for operational data for:
- Nokia (Alcatel-Lucent) SR OS 16.0.R3
- Cisco IOS XR 6.1.2
We’ll use “netconf_get” Ansible module for that.
Software version
The following software components are used in this lab:
- CentOS 7 with python 2.7.
- Ansible 2.6.4
- Nokia SR OS 16.0.R3 [guest VNF]
- Cisco IOS XR 6.1.2 [guest VNF]
See the previous article to get details how to build the lab
Topology
We are using our standard topology:

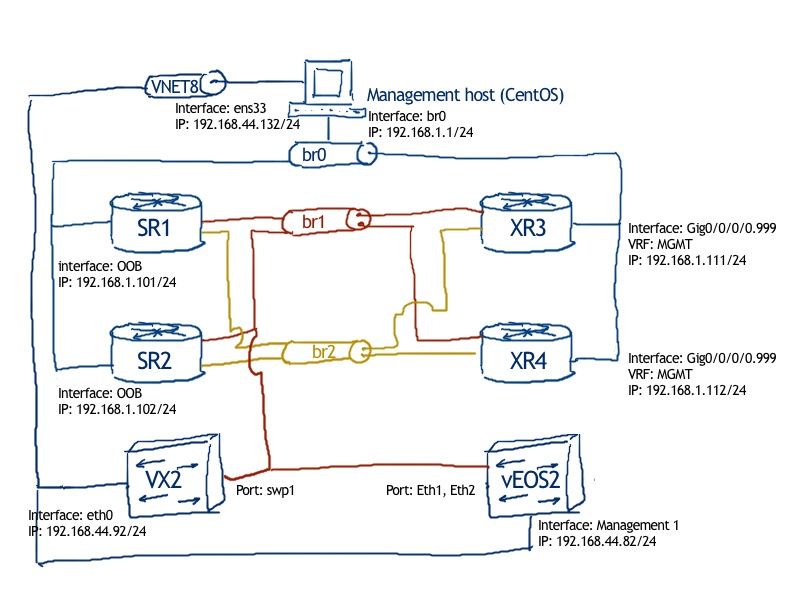
The logical topology is quite simple so we have just back to back connectivity between Nokia SR OS based VNF SR1 and Cisco IOS XR based VNF XR3, it’s just expressed in ASCII:
1 2 3 4 5 6 | <br> +----------------+ 10.11.33.0/24 +----------------+<br> | SR1 +----------------------+ XR3 |<br> +-------+--------+ 1/1/c1/1 g0/0/0/0 +--------+-------+<br> | .11 .33 |<br> | system: 10.0.0.11/32 | loopback0: 10.0.0.33/32 |
1 | <br> |
1 2 | <---OSPF:area0/p2p---><br> <-------------BGP:VPNv4/VPNv6------------><br> |
The initial configuration you can see in the attached files: 136_config_initial_XR3 136_config_initial_SR1
Brief topology check
From the configuration prospective we have configured just 3 topics:
- Interfaces;
- OSPF including Segment Routing;
- BGP for VPNv4/VPNv6 unicast address families;
This set of the configuration is very basic on the one hand; on the other hand, it represents basis for modern service provider network capable to provide all kind of IP/MPLS services for customers. We won’t go into explanation of the details, as each of them were covered into details earlier in multivendor setup with Nokia (Alcatel-Lucent) SR OS and Cisco IOS XR: interfaces, OSPF, Segment Routing and BGP IP VPNs. Here we’ll just review some operational commands.
We start with the status of the ports and interfaces on Nokia (Alcatel-Lucent) SR OS based network function SR1:
1 2 | []<br> A:admin@SR1# show port |
1 2 3 4 5 6 7 8 9 10 11 12 13 14 15 16 17 18 19 20 | ===============================================================================<br> Ports on Slot 1<br> ===============================================================================<br> Port Admin Link Port Cfg Oper LAG/ Port Port Port C/QS/S/XFP/<br> Id State State MTU MTU Bndl Mode Encp Type MDIMDX<br> -------------------------------------------------------------------------------<br> 1/1/c1 Up Link Up conn 100GBASE-LR4*<br> 1/1/c1/1 Up Yes Up 1514 1514 - netw null xgige<br> 1/1/c1/2 Down No Down 9212 9212 - netw null xgige<br> 1/1/c1/3 Down No Down 9212 9212 - netw null xgige<br> 1/1/c1/4 Down No Down 9212 9212 - netw null xgige<br> 1/1/c2 Up Link Up conn 100GBASE-LR4*<br> 1/1/c2/1 Down No Down 9212 9212 - netw null xgige<br> 1/1/c2/2 Down No Down 9212 9212 - netw null xgige<br> 1/1/c2/3 Down No Down 9212 9212 - netw null xgige<br> 1/1/c2/4 Down No Down 9212 9212 - netw null xgige<br> 1/1/c3 Down Down conn 100GBASE-LR4*<br> 1/1/c4 Down Down conn 100GBASE-LR4*<br> 1/1/c5 Down Down conn 100GBASE-LR4*<br> 1/1/c6 Down Down conn 100GBASE-LR4* |
===============================================================================
Ports on Slot A
===============================================================================
Port Admin Link Port Cfg Oper LAG/ Port Port Port C/QS/S/XFP/
Id State State MTU MTU Bndl Mode Encp Type MDIMDX
——————————————————————————-
A/1 Up Yes Up 1514 1514 – netw null faste MDI
A/4 Up No Ghost 1514 1514 – netw null faste
===============================================================================
[]
A:admin@SR1# show router interface
1 |
1 2 3 4 5 6 7 8 9 10 11 12 13 14 15 16 | ===============================================================================<br> Interface Table (Router: Base)<br> ===============================================================================<br> Interface-Name Adm Opr(v4/v6) Mode Port/SapId<br> IP-Address PfxState<br> -------------------------------------------------------------------------------<br> system Up Up/Up Network system<br> 10.0.0.11/32 n/a<br> fc00::10:0:0:11/128 PREFERRED<br> uplink1 Up Up/Up Network 1/1/c1/1<br> 10.11.33.11/24 n/a<br> fc00::10:11:33:11/112 PREFERRED<br> fe80::5054:ff:fe02:201/64 PREFERRED<br> -------------------------------------------------------------------------------<br> Interfaces : 2<br> ===============================================================================<br> |
Then we check the adjacency of the OSPF:
1 2 | []<br> A:admin@SR1# show router ospf neighbor |
1 | <br> |
1 2 3 4 5 6 7 8 9 10 11 | ===============================================================================<br> Rtr Base OSPFv2 Instance 0 Neighbors<br> ===============================================================================<br> Interface-Name Rtr Id State Pri RetxQ TTL<br> Area-Id<br> -------------------------------------------------------------------------------<br> uplink1 10.0.0.33 Full 1 0 33<br> 0.0.0.0<br> -------------------------------------------------------------------------------<br> No. of Neighbors: 1<br> ===============================================================================<br> |
Followed by the routing table:
1 2 | []<br> A:admin@SR1# show router route-table |
1 | <br> |
1 2 3 4 5 6 7 8 9 10 11 12 13 14 15 16 17 18 19 | ===============================================================================<br> Route Table (Router: Base)<br> ===============================================================================<br> Dest Prefix[Flags] Type Proto Age Pref<br> Next Hop[Interface Name] Metric<br> -------------------------------------------------------------------------------<br> 10.0.0.11/32 Local Local 00h04m12s 0<br> system 0<br> 10.0.0.33/32 Remote OSPF 00h03m41s 10<br> 10.11.33.33 11<br> 10.11.33.0/24 Local Local 00h04m12s 0<br> uplink1 0<br> -------------------------------------------------------------------------------<br> No. of Routes: 3<br> Flags: n = Number of times nexthop is repeated<br> B = BGP backup route available<br> L = LFA nexthop available<br> S = Sticky ECMP requested<br> ===============================================================================<br> |
And we finish with the status of BGP peering:
1 2 3 4 5 6 7 8 9 10 11 12 13 14 15 16 17 18 19 20 21 22 23 | []<br> A:admin@SR1# show router bgp summary<br> ===============================================================================<br> BGP Router ID:10.0.0.11 AS:65000 Local AS:65000<br> ===============================================================================<br> BGP Admin State : Up BGP Oper State : Up<br> !<br> ! OUTPUT IS OMITTED<br> !<br> ===============================================================================<br> BGP Summary<br> ===============================================================================<br> Legend : D - Dynamic Neighbor<br> ===============================================================================<br> Neighbor<br> Description<br> AS PktRcvd InQ Up/Down State|Rcv/Act/Sent (Addr Family)<br> PktSent OutQ<br> -------------------------------------------------------------------------------<br> 10.0.0.33<br> 65000 7 0 00h00m20s 0/0/0 (VpnIPv4)<br> 7 0 0/0/0 (VpnIPv6)<br> -------------------------------------------------------------------------------<br> |
For Cisco IOS XR based network function XR3 we take the same sequence of the verification activities. Here are we have status of the interfaces at XR3:
1 2 | RP/0/0/CPU0:XR3#show ipv4 int br<br> Sun Sep 30 21:04:49.178 UTC |
1 | <br> |
1 2 3 4 5 | Interface IP-Address Status Protocol Vrf-Name<br> Loopback0 10.0.0.33 Up Up default<br> MgmtEth0/0/CPU0/0 192.168.1.111 Up Up MGMT<br> GigabitEthernet0/0/0/0 10.11.33.33 Up Up default<br> GigabitEthernet0/0/0/1 unassigned Shutdown Down default<br> |
Then we check status of OSPF adjacency:
1 2 | RP/0/0/CPU0:XR3#show ospf neighbor<br> Sun Sep 30 21:05:42.804 UTC |
1 2 | * Indicates MADJ interface<br> # Indicates Neighbor awaiting BFD session up |
Neighbors for OSPF 0
Neighbor ID Pri State Dead Time Address Interface
10.0.0.11 1 FULL/ – 00:00:35 10.11.33.11 GigabitEthernet0/0/0/0
Neighbor is up for 00:02:07
1 |
1 | Total neighbor count: 1<br> |
Then routing table:
1 2 | RP/0/0/CPU0:XR3#show route ipv4<br> Sun Sep 30 21:05:27.025 UTC |
1 2 3 4 5 6 7 8 9 | Codes: C - connected, S - static, R - RIP, B - BGP, (>) - Diversion path<br> D - EIGRP, EX - EIGRP external, O - OSPF, IA - OSPF inter area<br> N1 - OSPF NSSA external type 1, N2 - OSPF NSSA external type 2<br> E1 - OSPF external type 1, E2 - OSPF external type 2, E - EGP<br> i - ISIS, L1 - IS-IS level-1, L2 - IS-IS level-2<br> ia - IS-IS inter area, su - IS-IS summary null, * - candidate default<br> U - per-user static route, o - ODR, L - local, G - DAGR, l - LISP<br> A - access/subscriber, a - Application route<br> M - mobile route, r - RPL, (!) - FRR Backup path |
Gateway of last resort is not set
1 |
1 2 3 4 | O 10.0.0.11/32 [110/1] via 10.11.33.11, 00:01:51, GigabitEthernet0/0/0/0<br> L 10.0.0.33/32 is directly connected, 00:01:53, Loopback0<br> C 10.11.33.0/24 is directly connected, 00:01:52, GigabitEthernet0/0/0/0<br> L 10.11.33.33/32 is directly connected, 00:01:52, GigabitEthernet0/0/0/0<br> |
And we are finishing with BGP peering for XR3:
1 2 3 4 5 6 7 8 9 10 11 | RP/0/0/CPU0:XR3#show bgp vpnv4 unicast summary<br> Sun Sep 30 21:05:12.386 UTC<br> BGP router identifier 10.0.0.33, local AS number 65000<br> BGP generic scan interval 60 secs<br> Non-stop routing is enabled<br> BGP table state: Active<br> Table ID: 0x0 RD version: 0<br> BGP main routing table version 1<br> BGP NSR Initial initsync version 1 (Reached)<br> BGP NSR/ISSU Sync-Group versions 0/0<br> BGP scan interval 60 secs |
1 | BGP is operating in STANDALONE mode. |
Process RcvTblVer bRIB/RIB LabelVer ImportVer SendTblVer StandbyVer
Speaker 1 1 1 1 1 0
Neighbor Spk AS MsgRcvd MsgSent TblVer InQ OutQ Up/Down St/PfxRcd
10.0.0.11 0 65000 6 7 1 0 0 00:01:35 0
1 |
1 |
As you see, adjacency is established both for OSPF and BGP. Actually, we could have omitted check of the routing table as BGP check implicitly includes it: if IPv4 addresses of loopbacks aren’t propagated properly, BGP session won’t come up.
After we have verified state of the network, we will check the same parameter using operational YANG models, hence we’ll go for telemetry data.
Cisco IOS // Operational YANG modules
In one of the OpenConfig articles we have collected all the YANG modules available on the Cisco IOS XR devices. Besides OpenConfig YANG modules, what we have used, there are also a lot of native modules, which are either configuration modules or operational ones. The operational has word “oper” in its name like on the example below:
1 2 3 4 5 6 7 8 9 10 11 12 13 14 | $ ls -l ~/Yang/yang/vendor/cisco/xr/651/ | grep 'oper' | more<br> -rw-rw-r--. 1 aaa aaa 28159 Sep 22 17:53 Cisco-IOS-XR-aaa-diameter-oper-sub1.yang<br> -rw-rw-r--. 1 aaa aaa 2969 Sep 22 17:53 Cisco-IOS-XR-aaa-diameter-oper.yang<br> -rw-rw-r--. 1 aaa aaa 5728 Sep 22 17:53 Cisco-IOS-XR-aaa-locald-oper-sub1.yang<br> -rw-rw-r--. 1 aaa aaa 2982 Sep 22 17:53 Cisco-IOS-XR-aaa-locald-oper.yang<br> -rw-rw-r--. 1 aaa aaa 4166 Sep 22 17:53 Cisco-IOS-XR-aaa-nacm-oper-sub1.yang<br> -rw-rw-r--. 1 aaa aaa 2915 Sep 22 17:53 Cisco-IOS-XR-aaa-nacm-oper.yang<br> -rw-rw-r--. 1 aaa aaa 13380 Sep 22 17:53 Cisco-IOS-XR-aaa-protocol-radius-oper-sub1.yang<br> -rw-rw-r--. 1 aaa aaa 15813 Sep 22 17:53 Cisco-IOS-XR-aaa-protocol-radius-oper-sub2.yang<br> -rw-rw-r--. 1 aaa aaa 5523 Sep 22 17:53 Cisco-IOS-XR-aaa-protocol-radius-oper.yang<br> -rw-rw-r--. 1 aaa aaa 4891 Sep 22 17:53 Cisco-IOS-XR-aaa-tacacs-oper-sub1.yang<br> -rw-rw-r--. 1 aaa aaa 1504 Sep 22 17:53 Cisco-IOS-XR-aaa-tacacs-oper.yang<br> !<br> ! FURTHER OUTPUT IS OMITTED<br> |
To understand what is inside, we can take an example of some module and render it using “pyang”:
1 2 3 4 5 6 7 8 9 10 11 12 13 14 15 16 17 18 19 20 21 22 23 24 25 26 27 28 29 30 31 32 33 | $ pyang -f tree -p ~/Yang/yang/vendor/cisco/xr/612/ ~/Yang/yang/vendor/cisco/xr/612/Cisco-IOS-XR-ifmgr-oper.yang<br> /home/aaa/Yang/yang/vendor/cisco/xr/612/Cisco-IOS-XR-ifmgr-oper-sub2.yang:9: warning: imported module Cisco-IOS-XR-types not used<br> module: Cisco-IOS-XR-ifmgr-oper<br> +--ro interface-dampening<br> | +--ro interfaces<br> | | +--ro interface* [interface-name]<br> | | +--ro if-dampening<br> | | | +--ro interface-dampening<br> | | | | +--ro penalty? uint32<br> | | | | +--ro is-suppressed-enabled? boolean<br> | | | | +--ro seconds-remaining? uint32<br> | | | | +--ro flaps? uint32<br> | | | | +--ro state? Im-state-enum<br> | | | +--ro state-transition-count? uint32<br> | | | +--ro last-state-transition-time? uint32<br> | | | +--ro is-dampening-enabled? boolean<br> | | | +--ro half-life? uint32<br> | | | +--ro reuse-threshold? uint32<br> | | | +--ro suppress-threshold? uint32<br> | | | +--ro maximum-suppress-time? uint32<br> | | | +--ro restart-penalty? uint32<br> | | | +--ro capsulation* []<br> | | | +--ro capsulation-dampening<br> | | | | +--ro penalty? uint32<br> | | | | +--ro is-suppressed-enabled? boolean<br> | | | | +--ro seconds-remaining? uint32<br> | | | | +--ro flaps? uint32<br> | | | | +--ro state? Im-state-enum<br> | | | +--ro capsulation-number? string<br> | | +--ro interface-name xr:Interface-name<br> | +--ro nodes<br> !<br> ! FURTHER OUTPUT IS OMITTED<br> |
As you might spot, all the nodes in this YANG module have “ro” attribute, meaning they are read only and we only can read data from them, not to configure. For each configuration YANG module there is typically operational module available.
Cisco IOS XR // Model-driven telemetry algorithm
As we’ve said in the beginning, we’ll try to collect information about network state in YANG operational modules using NETCONF. To do that we’ll use “netconf_get” Ansible module, which we have covered earlier. The algorithm is quite straightforward:
- We define some so called “configuration profiles” we’d like to collect telemetry data about. In our case they are: interfaces, OSPF routing and BGP routing
- Per each profile we have dedicated NETCONF request as Cisco IOS XR uses different YANG modules for different operational data
- Fetch telemetry data using NETCONF/YANG
- Parse data to extract some information
The last point is a bit synthetic in this article, as in real telemetry scenario you will use some messaging bus as Kafka for example, which will store those data, so you won’t need to parse it in that way. But about Kafka will talk in the separate article.
Cisco IOS XR // Ansible playbook for telemetry collection
To implement the algorithm above, our playbook using roles has the following structure:
1 2 3 4 5 6 7 8 9 10 11 12 13 14 15 16 17 18 19 20 21 22 23 | +--ansible<br> +--136_lab.yml<br> +--group_vars<br> | +--cisco<br> | | +--cisco_host.yml<br> | +--nokia<br> | +--nokia_host.yml<br> +--roles<br> +--cisco<br> | +--136_lab<br> | +--tasks<br> | | +--comapring_loop.yml<br> | | +--main.yml<br> | +--templates<br> | | +--cisco_telemetry_interfaces.j2<br> | | +--cisco_telemetry_routing_bgp.j2<br> | | +--cisco_telemetry_routing_ospf.j2<br> | | +--netconf_request.j2<br> | +--vars<br> | +--XR3_infra_profile.yml<br> +--nokia<br> +--136_lab<br> +--tbd<br> |
The master Ansible playbook has very easy structure:
1 2 3 4 5 6 | $ cat 136_lab.yml<br> ---<br> - hosts: cisco<br> connection: netconf<br> roles:<br> - { role: cisco/136_lab } |
1 | <br> |
1 2 3 4 5 | - hosts: nokia<br> connection: netconf<br> roles:<br> - { role: nokia/136_lab }<br> ...<br> |
Same structure we have used more or less with all of our Ansible playbook with roles.
The “group_vars” for Cisco IOS XR contains authentication data and some other general parameters:
1 2 3 4 5 6 7 | $ cat group_vars/cisco/cisco_host.yml<br> ---<br> ansible_network_os: iosxr<br> ansible_user: cisco<br> ansible_pass: cisco<br> ansible_ssh_pass: cisco<br> ...<br> |
Before we go deeper into details of playbooks, let’s take a look into file with “vars” for Cisco IOS XR based network function XR3:
1 2 3 4 5 6 7 8 9 10 11 12 | $ cat roles/cisco/136_lab/vars/XR3_infra_profile.yml<br> ---<br> node:<br> hostname: XR3<br> vendor: cisco<br> os: iosxr<br> version: 6.1.2<br> configuration_profiles:<br> - profile: interfaces<br> - profile: routing_ospf<br> - profile: routing_bgp<br> ...<br> |
As we have mentioned above, you can see here different configuration profiles, which are used for checking telemetry.
In reality, initial configuration was also done using these configuration profiles based configuration YANG modules, but this is out of scope for this article.
Now, it’s time to take a look into working horses of this automation using Ansible for telemetry, that is actual playbooks with tasks. Let’ start with “main.yml”:
1 2 3 4 5 6 | $ cat roles/cisco/136_lab/tasks/main.yml<br> ---<br> - name: VERIFICATION // {{ inventory_hostname }} // IMPORTING INFRASTRUCTURE PROFILE<br> include_vars:<br> file: "{{ inventory_hostname }}_infra_profile.yml"<br> name: PROFILE |
1 2 3 4 5 | - name: VERIFICATION // {{ inventory_hostname }} // DELETE PREVIOUS TEST REPORT<br> file:<br> dest: /tmp/{{ inventory_hostname }}_test_report.txt<br> state: absent<br> ignore_errors: yes |
1 | <code lang="yaml"> |
– name: VERIFICATION // {{ inventory_hostname }} // CREATING TEST REPORT
file:
dest: /tmp/{{ inventory_hostname }}_test_report.txt
state: touch
1 | <code lang="yaml"> |
– name: VERIFICATION // {{ inventory_hostname }} // COLLECTING TELEMETRY AND SEARCHING DATA
include_tasks: comparing_loop.yml
loop: “{{ PROFILE.node.configuration_profiles }}”
1 | <code lang="yaml"> |
– name: VERIFICATION // {{ inventory_hostname }} // COMPILING REPORT
shell: “cat /tmp/temp_report_136_{{ inventory_hostname }}_* > /tmp/{{ inventory_hostname }}_test_report.txt”
1 | <br> |
1 |
1 2 3 4 | - name: VERIFICATION // {{ inventory_hostname }} // REPORTING READINESS<br> debug:<br> msg: "Collection of telemetry data from {{ inventory_hostname }} is done."<br> ...<br> |
Take a look at article about Ansible roles, if you have questions on this structure.
In the playbook above we do the following actions:
- We import the file with variables, which contains configuration profiles to check
- We try to delete previous file with report. Even if it doesn.t exist, we go further
- We collect telemetry for each profile (looping per profile name) using external playbook with tasks called “comparing_loop.yml”
- We combine all the files with reports in a single report
- We send message that everything is done
You might have spot that the crucial part is concentrated in the 3rd task, where we collect telemetry using another playbook, hence the next obvious step is to review that playbook:
1 2 3 4 5 6 7 | $ cat roles/cisco/136_lab/tasks/comparing_loop.yml<br> ---<br> - name: VERIFICATION // {{ inventory_hostname }} // COLLECTING TELEMETRY AND SEARCHING DATA // FETCHING TELEMETRY DATA<br> netconf_get:<br> filter: "{{ lookup ('template', 'netconf_request.j2') }}"<br> display: json<br> register: output_json |
1 2 3 4 | - name: VERIFICATION // {{ inventory_hostname }} // COLLECTING TELEMETRY AND SEARCHING DATA // SAVING TELEMETRY DATA<br> copy:<br> content: "{{ output_json.output | to_nice_json }}"<br> dest: /tmp/{{ inventory_hostname }}/{{ inventory_hostname }}_{{ item.profile }}_yang_telemetry.json |
1 | <code lang="yaml"> |
– name: VERIFICATION // {{ inventory_hostname }} // COLLECTING TELEMETRY AND SEARCHING DATA // MODIFIICATION OF COLLECTED TELEMETRY FOR PYTHON PROCESSING
replace:
path: /tmp/{{ inventory_hostname }}/{{ inventory_hostname }}_{{ item.profile }}_yang_telemetry.json
regexp: ‘-‘
replace: ‘_’
1 | <code lang="yaml"> |
– name: VERIFICATION // {{ inventory_hostname }} // COLLECTING TELEMETRY AND SEARCHING DATA // IMPORTING COLLECTED TELEMETRY DATA
include_vars:
file: /tmp/{{ inventory_hostname }}/{{ inventory_hostname }}_{{ item.profile }}_yang_telemetry.json
name: COLLECTED
1 | <br> |
1 |
1 2 3 4 5 6 | - name: VERIFICATION // {{ inventory_hostname }} // COLLECTING TELEMETRY AND SEARCHING DATA // COMPILING {{ item.profile }}<br> template:<br> src: cisco_telemetry_{{ item.profile }}.j2<br> dest: /tmp/temp_report_136_{{ inventory_hostname }}_{{ item.profile }}.txt<br> mode: 0755<br> ...<br> |
In this playbook we have the same number of tasks, as in the previous one, so it’s quite big. I guess, you want to know, what exactly we are doing here. Here we go:
- We send the RPC message over NETCONF to collect live data for particular operational YANG modules. The proper request is chosen from the template “netconf_request.j2” based on the name of the configuration profile
- We save output of the previous command to “/tmp” folder so that we can review details later on.
- We replace all “-“ with “_” in saved telemetry output, as it’s impossible in Python for variable to contain “-“ in its name.
- We import back saved telemetry data as variables.
- We look for some interesting for us parameters in telemetry based on some predefined (by ourselves) template.
As a lot of real action is dependent on files with templates, we need to understand them. The first template called “netconf_request.j2” is used for creating proper NETCONF request:
1 2 | $ cat roles/cisco/136_lab/templates/netconf_request.j2<br> {% if item.profile == 'interfaces' %} |
1 | <code lang="yaml"> |
{% elif item.profile == ‘routing_ospf’ %}
1 | <code lang="yaml"> |
{% elif item.profile == ‘routing_bgp’ %}
1 | <br> |
1 | {% endif %}<br> |
Depending on the name of the configuration profile, we create proper request. The namespace and the name of the block we check within file with the operational YANG modules. The following example for interfaces:
1 2 3 4 5 6 7 8 9 10 11 12 13 14 15 16 | cat ~/Yang/yang/vendor/cisco/xr/612/Cisco-IOS-XR-ifmgr-oper.yang | grep 'namespace\|container'<br> namespace "http://cisco.com/ns/yang/Cisco-IOS-XR-ifmgr-oper";<br> container interfaces {<br> container interface-dampening {<br> container interfaces {<br> container if-dampening {<br> container nodes {<br> container show {<br> container dampening {<br> container if-handles {<br> container interfaces {<br> container interface-properties {<br> container data-nodes {<br> container locationviews {<br> container pq-node-locations {<br> container system-view {<br> |
For XML schema we take the parameter of the “namespace” from the corresponding YANG module. For the request itself we take the name of inter interesting high-level container. In the example above we have 2 high-level containers: “interface-dampening” and “interface-properties”. We are interested only in the second one, so we put its name.
The rest of the templates are used to extract some information from the telemetry. As an example, for interfaces we check the status of the ports:
1 2 3 4 | $ cat roles/cisco/136_lab/templates/cisco_telemetry_interfaces.j2<br> +------------------------------------------+<br> | Checking of the interfaces status |<br> +------------------------------------------+ |
1 2 3 | {% for port_current in COLLECTED.rpc_reply.data.interface_properties.data_nodes.data_node.locationviews.locationview.interfaces.interface %}<br> Port: {{ port_current.interface_name }}<br> Status: {{ port_current.actual_line_state }} |
{% endfor %}
1 |
1 2 3 | ===========================================<br> Verification of interfaces is done<br> ===========================================<br> |
For OSPF routing we check the status of the neighbors:
1 2 3 4 | $ cat roles/cisco/136_lab/templates/cisco_telemetry_routing_ospf.j2<br> +------------------------------------------+<br> | Checking of the OSPF status |<br> +------------------------------------------+ |
1 2 3 4 5 6 | {% if COLLECTED.rpc_reply.data.ospf.processes.process.default_vrf.adjacency_information is defined %}<br> Neighbor:<br> RID: {{ COLLECTED.rpc_reply.data.ospf.processes.process.default_vrf.adjacency_information.neighbors.neighbor.neighbor_id }}<br> IP: {{ COLLECTED.rpc_reply.data.ospf.processes.process.default_vrf.adjacency_information.neighbors.neighbor.neighbor_address_xr }}<br> Connected to: {{ COLLECTED.rpc_reply.data.ospf.processes.process.default_vrf.adjacency_information.neighbors.neighbor.interface_name }}<br> Status: {{ COLLECTED.rpc_reply.data.ospf.processes.process.default_vrf.adjacency_information.neighbors.neighbor.neighbor_state }} |
{% else %}
After software update:
There is no OSPF neighbors detected
{% endif %}
1 |
1 2 3 | ===========================================<br> Verification of OSPF neighbors is done<br> ===========================================<br> |
And for the BGP routing, we check the status of the BGP peers:
1 2 3 4 | $ cat roles/cisco/136_lab/templates/cisco_telemetry_routing_bgp.j2<br> +------------------------------------------+<br> | Checking of the BGP status |<br> +------------------------------------------+ |
1 2 3 4 5 | {% if COLLECTED.rpc_reply.data.bgp.instances is defined %}<br> Neighbor:<br> ID: {{ COLLECTED.rpc_reply.data.bgp.instances.instance.instance_active.default_vrf.neighbors.neighbor.neighbor_address }}<br> State: {{ COLLECTED.rpc_reply.data.bgp.instances.instance.instance_active.default_vrf.neighbors.neighbor.connection_state }}<br> AFI/SAFI: {% for afi in COLLECTED.rpc_reply.data.bgp.instances.instance.instance_active.default_vrf.neighbors.neighbor.af_data %}{{ afi.af_name }} {% endfor %} |
{% else %}
Problem with BGP process on local node ({{ inventory_hostname }})
{% endif %}
1 |
1 2 3 | ===========================================<br> Verification of BGP neighbors is done<br> ===========================================<br> |
When the preparation is done meaning all the playbooks, variables and templates are defined, we can test them.
Cisco IOS // Collecting telemetry via NETCONF/YANG with Ansible
For now the names of the variable from telemetry don’t say you anything, so let’s execute our Ansible playbook to collect telemetry:
1 | $ ansible-playbook 136_lab.yml --limit=XR3 |
1 | PLAY [cisco] *********************************************************************************************************************************************************** |
TASK [Gathering Facts] *************************************************************************************************************************************************
ok: [XR3]
TASK [cisco/136_lab : VERIFICATION // XR3 // IMPORTING INFRASTRUCTURE PROFILE] *****************************************************************************************
ok: [XR3]
TASK [cisco/136_lab : VERIFICATION // XR3 // DELETE PREVIOUS TEST REPORT] **********************************************************************************************
changed: [XR3]
TASK [cisco/136_lab : VERIFICATION // XR3 // CREATING TEST REPORT] *****************************************************************************************************
changed: [XR3]
TASK [cisco/136_lab : VERIFICATION // XR3 // COLLECTING TELEMETRY AND SEARCHING DATA] **********************************************************************************
included: /home/aaa/ansible/roles/cisco/136_lab/tasks/comparing_loop.yml for XR3
included: /home/aaa/ansible/roles/cisco/136_lab/tasks/comparing_loop.yml for XR3
included: /home/aaa/ansible/roles/cisco/136_lab/tasks/comparing_loop.yml for XR3
TASK [cisco/136_lab : VERIFICATION // XR3 // COLLECTING TELEMETRY AND SEARCHING DATA // FETCHING TELEMETRY DATA] *******************************************************
ok: [XR3]
TASK [cisco/136_lab : VERIFICATION // XR3 // COLLECTING TELEMETRY AND SEARCHING DATA // SAVING TELEMETRY DATA] *********************************************************
changed: [XR3]
TASK [cisco/136_lab : VERIFICATION // XR3 // COLLECTING TELEMETRY AND SEARCHING DATA // MODIFIICATION OF COLLECTED TELEMETRY FOR PYTHON PROCESSING] ********************
changed: [XR3]
TASK [cisco/136_lab : VERIFICATION // XR3 // COLLECTING TELEMETRY AND SEARCHING DATA // IMPORTING COLLECTED TELEMETRY DATA] ********************************************
ok: [XR3]
TASK [cisco/136_lab : VERIFICATION // XR3 // COLLECTING TELEMETRY AND SEARCHING DATA // COMPILING interfaces] **********************************************************
ok: [XR3]
TASK [cisco/136_lab : VERIFICATION // XR3 // COLLECTING TELEMETRY AND SEARCHING DATA // FETCHING TELEMETRY DATA] *******************************************************
ok: [XR3]
TASK [cisco/136_lab : VERIFICATION // XR3 // COLLECTING TELEMETRY AND SEARCHING DATA // SAVING TELEMETRY DATA] *********************************************************
changed: [XR3]
TASK [cisco/136_lab : VERIFICATION // XR3 // COLLECTING TELEMETRY AND SEARCHING DATA // MODIFIICATION OF COLLECTED TELEMETRY FOR PYTHON PROCESSING] ********************
changed: [XR3]
TASK [cisco/136_lab : VERIFICATION // XR3 // COLLECTING TELEMETRY AND SEARCHING DATA // IMPORTING COLLECTED TELEMETRY DATA] ********************************************
ok: [XR3]
TASK [cisco/136_lab : VERIFICATION // XR3 // COLLECTING TELEMETRY AND SEARCHING DATA // COMPILING routing_ospf] ********************************************************
changed: [XR3]
TASK [cisco/136_lab : VERIFICATION // XR3 // COLLECTING TELEMETRY AND SEARCHING DATA // FETCHING TELEMETRY DATA] *******************************************************
ok: [XR3]
TASK [cisco/136_lab : VERIFICATION // XR3 // COLLECTING TELEMETRY AND SEARCHING DATA // SAVING TELEMETRY DATA] *********************************************************
changed: [XR3]
TASK [cisco/136_lab : VERIFICATION // XR3 // COLLECTING TELEMETRY AND SEARCHING DATA // MODIFIICATION OF COLLECTED TELEMETRY FOR PYTHON PROCESSING] ********************
changed: [XR3]
TASK [cisco/136_lab : VERIFICATION // XR3 // COLLECTING TELEMETRY AND SEARCHING DATA // IMPORTING COLLECTED TELEMETRY DATA] ********************************************
ok: [XR3]
TASK [cisco/136_lab : VERIFICATION // XR3 // COLLECTING TELEMETRY AND SEARCHING DATA // COMPILING routing_bgp] *********************************************************
changed: [XR3]
TASK [cisco/136_lab : VERIFICATION // XR3 // COMPILING REPORT] *********************************************************************************************************
changed: [XR3]
TASK [cisco/136_lab : VERIFICATION // XR3 // REPORTING READINESS] ******************************************************************************************************
ok: [XR3] => {
“msg”: “Collection of telemetry data from XR3 is done.”
}
PLAY [nokia] ***********************************************************************************************************************************************************
skipping: no hosts matched
1 |
1 2 | PLAY RECAP *************************************************************************************************************************************************************<br> XR3 : ok=24 changed=11 unreachable=0 failed=0<br> |
After the execution of the playbook is finished, we can check the results:
1 2 3 4 | $ ls -l /tmp/XR3 | grep 'XR3'<br> -rw-rw-r--. 1 aaa aaa 17166 Oct 2 07:55 XR3_interfaces_yang_telemetry.json<br> -rw-rw-r--. 1 aaa aaa 102808 Oct 2 07:56 XR3_routing_bgp_yang_telemetry.json<br> -rw-rw-r--. 1 aaa aaa 237501 Oct 2 07:56 XR3_routing_ospf_yang_telemetry.json<br> |
These 3 files contain telemetry data, what we have requested: interfaces, OSPF and BGP. To be honest, they are very huge, especially BGP’s telemetry. So I provide you some snippet from interface level telemetry:
1 2 3 4 5 6 7 8 9 10 11 12 13 14 15 16 17 18 19 20 21 22 23 24 25 26 27 28 29 30 31 32 33 34 35 36 37 38 39 40 41 42 43 44 45 46 47 48 49 50 51 52 53 54 55 56 57 58 59 | $ cat /tmp/XR3/XR3_interfaces_yang_telemetry.json<br> {<br> "rpc_reply": {<br> "data": {<br> "interface_properties": {<br> "data_nodes": {<br> "data_node": {<br> "data_node_name": "0/0/CPU0",<br> "locationviews": {<br> "locationview": {<br> "interfaces": {<br> "interface": [<br> {<br> "actual_line_state": "im_state_up",<br> "actual_state": "im_state_up",<br> "bandwidth": "0",<br> "encapsulation": "fint_base",<br> "encapsulation_type_string": "FINT_BASE_CAPS",<br> "interface": "FINT0/0/CPU0",<br> "interface_name": "FINT0/0/CPU0",<br> "l2_transport": "false",<br> "line_state": "im_state_up",<br> "mtu": "8000",<br> "state": "im_state_up",<br> "sub_interface_mtu_overhead": "0",<br> "type": "IFT_FINT_INTF"<br> },<br> {<br> "actual_line_state": "im_state_up",<br> "actual_state": "im_state_up",<br> "bandwidth": "1000000",<br> "encapsulation": "ether",<br> "encapsulation_type_string": "ARPA",<br> "interface": "GigabitEthernet0/0/0/0",<br> "interface_name": "GigabitEthernet0/0/0/0",<br> "l2_transport": "false",<br> "line_state": "im_state_up",<br> "mtu": "1514",<br> "state": "im_state_up",<br> "sub_interface_mtu_overhead": "0",<br> "type": "IFT_GETHERNET"<br> },<br> {<br> "actual_line_state": "im_state_admin_down",<br> "actual_state": "im_state_admin_down",<br> "bandwidth": "1000000",<br> "encapsulation": "ether",<br> "encapsulation_type_string": "ARPA",<br> "interface": "GigabitEthernet0/0/0/1",<br> "interface_name": "GigabitEthernet0/0/0/1",<br> "l2_transport": "false",<br> "line_state": "im_state_admin_down",<br> "mtu": "1514",<br> "state": "im_state_admin_down",<br> "sub_interface_mtu_overhead": "0",<br> "type": "IFT_GETHERNET"<br> },<br> !<br> ! FURTHER OUTPUT IS OMITTED<br> |
Actually all the information you can collect through various show commands are available in JSON format in telemetry. For OSPF and BGP there is MUCH more information, what you can review. Like for OSPF you will have even all LSAs from LSDB in telemetry output.
The last point in verification for Cisco will be to take a look onto test report, where we check:
- State of the interfaces
- Status of the OSPF neighbors
- Status of the BGP peering
As we have explained earlier, we create the test report per configuration profile and then merge together:
1 2 3 4 | $ cat /tmp/XR3_test_report.txt<br> +------------------------------------------+<br> | Checking of the interfaces status |<br> +------------------------------------------+ |
1 2 | Port: FINT0/0/CPU0<br> Status: im_state_up |
Port: GigabitEthernet0/0/0/0
Status: im_state_up
Port: GigabitEthernet0/0/0/1
Status: im_state_admin_down
Port: Loopback0
Status: im_state_up
Port: MgmtEth0/0/CPU0/0
Status: im_state_up
Port: Null0
Status: im_state_up
Port: nV_Loopback0
Status: im_state_up
Port: nV_Loopback1
Status: im_state_up
===========================================
Verification of interfaces is done
===========================================
+——————————————+
| Checking of the BGP status |
+——————————————+
Problem with BGP process on local node (XR3)
===========================================
Verification of BGP neighbors is done
===========================================
+——————————————+
| Checking of the OSPF status |
+——————————————+
Neighbor:
RID: 10.0.0.11
IP: 10.11.33.11
Connected to: GigabitEthernet0/0/0/0
Status: mgmt_nbr_full
1 |
1 2 3 | ===========================================<br> Verification of OSPF neighbors is done<br> ===========================================<br> |
I think, you have spotted that BGP has the problems in the output. The reason for that is that 2 GB RAM in my virtual lab is not sufficient for telemetry, and NETCONF/YANG request to collect BGP telemetry data pushes the memory state on the virtual network function XR3 to critical state and BGP process is broken afterwards. Nevertheless, if we increase the amount of available memory, then it’s OK. So, that’s how model-driven telemetry looks like on Cisco IOS XR. Here you can download the ansible playbooks for this article: 136_lab.tar
Lessons learned
As we have learned that collection of the telemetry data via NETCONF is quite resource intensive task, so it shouldn’t be used in production. We advise you to go for gRPC/gNMI to stream telemetry data.
Conclusion
For the sake of brevity I have reduced the output of the provided commands, but the amount of the information contained in the telemetry is just overwhelming. It’s really new oil in the networking, as this telemetry information allows you to build any kind of business logic. Later on we’ll review Kafka, so you will get much more understanding how the whole solution is working, but even now you can assess the amount of information in model-driven telemetry. In the nxt article we’ll take a look on model-driven telemetry in Nokia SR OS. Take care and good bye!
Support us
P.S.
If you have further questions or you need help with your networks, I’m happy to assist you, just send me message (https://karneliuk.com/contact/). Also don’t forget to share the article on your social media, if you like it.
BR,
Anton Karneliuk