


Hello my friend,
We hope you are doing well and staying safe during this COVID times. To make your stay a bit more pleasant, we are offering you and interesting read, which will give you ideas how to test network performance between your endpoints, which can be any Server, virtual machine (VM), container, or even Raspberry PI node. Yes, we continue our troubleshooting series. Take a brew, and get started.
2
3
4
5
retrieval system, or transmitted in any form or by any
means, electronic, mechanical or photocopying, recording,
or otherwise, for commercial purposes without the
prior permission of the author.
Can automation help with fixing your network issues?
Automation is your extra pair of hands. Or even more than that. Capability to create the network automation solutions, from a basic scripts for info collection or simple configuration to complicated logic, which takes into account exiting environment and is integrated with your other OSS/BSS, is one of the key skills, what allows you to build a successful career in the constantly changing network field.
We have created a new training, which is focused only on the Nornir and you can use it for the network (and not only) automation. It is an organic extension of our network automation training, which assumes you are already OK with Python and looking to learn new things, which can even more improve your automation skills to give you possibility to become the most efficient Engineer, who can automate networks and whole IT infrastructure.
Training includes the integration of Nornir with NetBox, configuration and validation of Cisco, Nokia, Arista, Cumulus Linux and CentOS Linux devices with CLI, NETCONF, RESTCONF, gNMI. In the same way as the original one, it is based on the real experience and real use cases, which will give you insights how to apply them for your networks and IT even during the training. Don’t loose your future.
Brief description
In the first blogpost in this series we have listed the most important and useful to help you with the troubleshooting of your network problems, or to prove others that the problems are not network related :-). So far you have seen how to get your public IP and how to measure the bandwidth of your Internet connectivity. Today’s focus is to measure the bandwidth of the network connectivity between your two endpoints. Why do you want to measure the network performance (i.e. what are the use cases)?
- Test the connectivity inside your network (e.g., between the servers inside your data centre, between the laptops in your office network, between your smartphone and server inside your campus, etc). Such measurements are useful to understand the health of network in your remit and possibly to figure out the bottle necks.
- Test the connectivity between your networks (e.g., between your campuses or data centres) over the Internet or WAN L2 circuits. Such measurements are useful to figure out if your ISPs or WAN provider has issues and raise a trouble ticket with them.
Beware, the result of the iPerf tests are depend also on resources available on your compute node, drivers of the operating system and so on.
The endpoint is a broad term, which is related to any computing node, where you can install and run the corresponding application:
- Server (Windows or any Linux, e.g., Ubuntu/Debian, CentOS/Red Hat)
- VM (Windows or any Linux, e.g., Ubuntu/Debian, CentOS/Red Hat)
- Container (any Linux, e.g., Ubuntu/Debian, CentOS/Red Hat)
- Laptop (MAC, Windows, or any Linux, e.g., Ubuntu/Debian, CentOS/Red Hat)
Those nodes are traditional for any cloud, data centre, service provider, and enterprise network. However, you may go even further and measure the bandwidth from/to the following nodes
- Raspberry PI (running Raspberry PI OS or any Linux)
- Android smartphone
- Apple iPhone/iTab
Full list of the available tools you can find at the official website of the iPerf tool.
So, what exactly allows iPerf for you to measure? It allows you to measure the network throughput between any two your endpoints. There are quite a few parameters, which you can specify:
- Throughput from client to server or from server to client (both is possible).
- Throughput for TCP or UDP traffic.
- Throughput for a single or multiple streams (i.e., how many sockets are opened and pairs of source/destination ports are used).
- Custom or random source port
- Custom or default destination port
- The duration of the test
- … and some other parameters
Besides the throughout figure itself you will also see the amount of the retransmits for TCP stream (if any) and packet loss for UDP (if any).
Usage
Let’s take a look how to use iPerf. By the way, the version you are about to see is the iPerf3, which is the latest available stable release. However, it is not the first version, and the iPerf2 was used in the industry for quite a while.
The documentation for both version are available at the official website of iPerf.
To give you better understand on what we are testing, take a look on the following diagram.

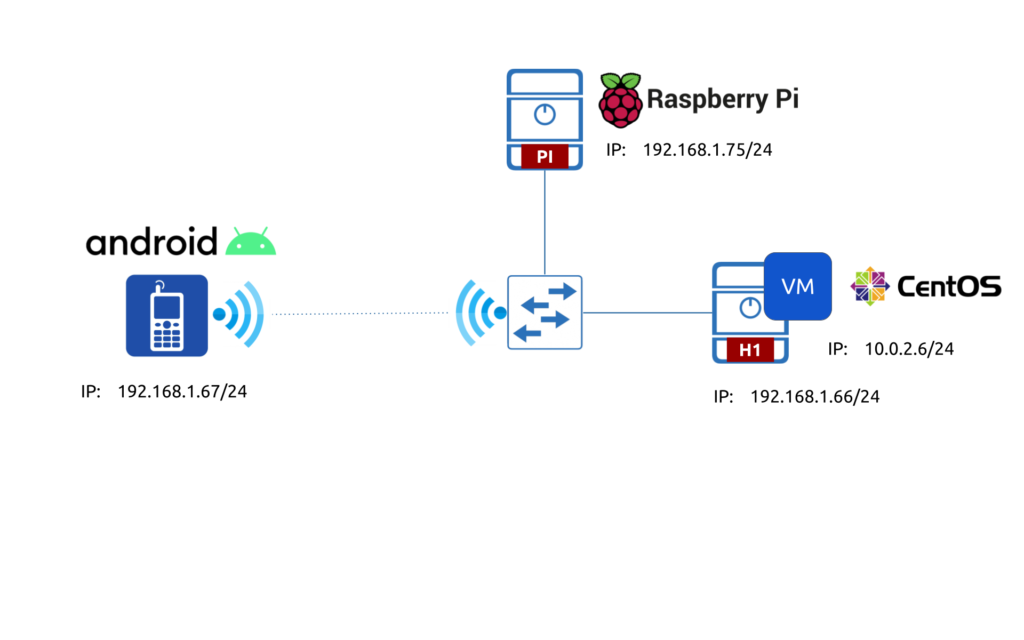
Despite you may think that this is not much use for it, we believe, it gives you some insights, how you can extrapolate this to your setup (e.g., public/private cloud, service provider 5G POD, campus network with WLAN and/or WAN links, etc).
#1. Installation
#1.1 CentOS
Depending on the operating system running on your endpoint, there will be different approaches for installation. On the CentOS Linux you can install using the official repository:
2
$ sudo dnf -y install iperf3
Use “yum” instead of “dnf” for CentOS 7.
After the installation is complete, you can check the installed version. It is important to know the version, as some features were added in 3.1 and were not available in 3.0 version of iPerf.
2
3
4
iperf 3.5 (cJSON 1.5.2)
Linux nnat.karneliuk.com 4.18.0-240.1.1.el8_3.x86_64 #1 SMP Thu Nov 19 17:20:08 UTC 2020 x86_64
Optional features available: CPU affinity setting, IPv6 flow label, SCTP, TCP congestion algorithm setting, sendfile / zerocopy, socket pacing, authentication
As you remember, the CentOS 8 is running as a VM.
#1.2. Raspberry PI OS (or Ubuntu/Debian)
Small and cheap Rasperry PI can be quite a powerful workhorse for the network monitoring and management. It OS is based on the Debian and, therefore, has the same package manager and approach to install the packages. As such, the installation of the iPerf there looks like that:
2
$ sudo apt-get install -y iperf3
Despite the Raspberry PI run the “normal” Linux, it has different system architecture. It is ARM, rather than x86. As such, the corresponding packages should support ARM in order you can use them.
Once installed, check the version of iPerf:
2
3
4
iperf 3.6 (cJSON 1.5.2)
Linux raspberrypi 5.4.83-v7l+ #1379 SMP Mon Dec 14 13:11:54 GMT 2020 armv7l
Optional features available: CPU affinity setting, IPv6 flow label, SCTP, TCP congestion algorithm setting, sendfile / zerocopy, socket pacing, authentication
#1.3. Android smartphone
Originally we didn’t plan cover that part, as we even didn’t know about such a possibility. However, as we know about it now, we’ll try to add the smartphone part as well. To have it installed, go to the Google Play Store and search for “iperf3”.


Press the Install button and you will get it in a few minutes. Once it is installed you will launch it. Put the first switch in the position iperf3 just by pressing it (1). Afterwards, type in the cli part “-v” key and press the button stopped to run it (2).

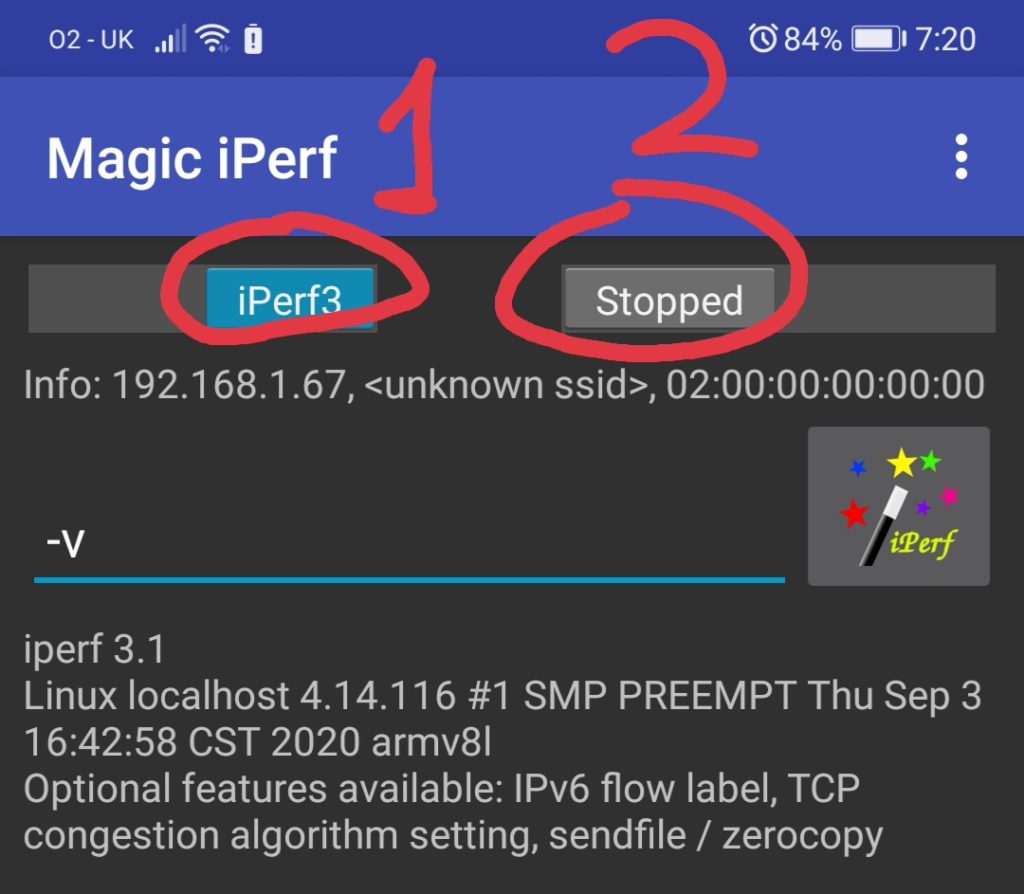
As you can see, the Android smartphone is also ARM based device.
The installation is complete and we can progress with the tests.
#2. Simple tests
iPerf is a client-server application, where the server is listening for the connectivities from the customers on some port and the customer builds the session, which is in fact used to measure the performance. As such, the first task is to launch the server side (we do it at our Raspberry PI node) using the command “iperf3 -s“:
2
3
4
-----------------------------------------------------------
Server listening on 5201
-----------------------------------------------------------
You can see that server is listening for the connections on the default iperf3 port, which is 5201/TCP. The server is running in the foreground and you will immediately see any details of running tests
Now we can test the throughput from our VM running CentOS using the command “iperf3 -c server_ip“:
2
3
4
5
6
7
8
9
10
11
12
13
14
15
16
17
18
19
20
Connecting to host 192.168.1.75, port 5201
[ 5] local 10.0.2.6 port 49640 connected to 192.168.1.75 port 5201
[ ID] Interval Transfer Bitrate Retr Cwnd
[ 5] 0.00-1.00 sec 877 KBytes 7.17 Mbits/sec 44 34.2 KBytes
[ 5] 1.00-2.00 sec 376 KBytes 3.08 Mbits/sec 22 22.8 KBytes
[ 5] 2.00-3.00 sec 643 KBytes 5.27 Mbits/sec 42 4.28 KBytes
[ 5] 3.00-4.00 sec 847 KBytes 6.93 Mbits/sec 56 4.28 KBytes
[ 5] 4.00-5.00 sec 768 KBytes 6.30 Mbits/sec 44 31.4 KBytes
[ 5] 5.00-6.00 sec 361 KBytes 2.96 Mbits/sec 54 28.5 KBytes
[ 5] 6.00-7.00 sec 314 KBytes 2.57 Mbits/sec 40 4.28 KBytes
[ 5] 7.00-8.02 sec 408 KBytes 3.28 Mbits/sec 41 4.28 KBytes
[ 5] 8.02-9.01 sec 471 KBytes 3.92 Mbits/sec 32 14.3 KBytes
[ 5] 9.01-10.03 sec 157 KBytes 1.26 Mbits/sec 14 4.28 KBytes
- - - - - - - - - - - - - - - - - - - - - - - - -
[ ID] Interval Transfer Bitrate Retr
[ 5] 0.00-10.03 sec 5.10 MBytes 4.27 Mbits/sec 389 sender
[ 5] 0.00-10.05 sec 4.94 MBytes 4.12 Mbits/sec receiver
iperf Done.
This output provides a lot of useful information, which explains how your network works:
- We have specified the server IP, but not the port. As such, the client will use the default destination port, which is 5201/TCP.
- The source port is randomly generated and is 49460/TCP for this session (for the next session, it can be the same or it can be different).
- The speed is measured in the direction from client to server (client sends data to server).
- The default measurement interval is 10 seconds and the speed is split into 10 intervals of 1 second. That gives some granular information about the speed deviation across the time. The healthy network should have either stable speed results or some small speed in the beginning and than stable based on the standard TCP implementation (slow start and window mechanism).
- Retransmissions are also provided. For healthy network it shall be 0.
As you can figure out, the connectivity from the client (VM with CentOS) to the server (Raspberry PI with PI OS) is not ideal.
The same results are also available on the server side :
2
3
4
5
6
7
8
9
10
11
12
13
14
15
16
17
18
19
[ 5] local 192.168.1.75 port 5201 connected to 192.168.1.66 port 63932
[ ID] Interval Transfer Bitrate
[ 5] 0.00-1.00 sec 356 KBytes 2.92 Mbits/sec
[ 5] 1.00-2.00 sec 710 KBytes 5.82 Mbits/sec
[ 5] 2.00-3.00 sec 649 KBytes 5.31 Mbits/sec
[ 5] 3.00-4.00 sec 870 KBytes 7.12 Mbits/sec
[ 5] 4.00-5.00 sec 730 KBytes 5.98 Mbits/sec
[ 5] 5.00-6.00 sec 405 KBytes 3.32 Mbits/sec
[ 5] 6.00-7.00 sec 284 KBytes 2.32 Mbits/sec
[ 5] 7.00-8.00 sec 456 KBytes 3.74 Mbits/sec
[ 5] 8.00-9.00 sec 396 KBytes 3.24 Mbits/sec
[ 5] 9.00-10.00 sec 203 KBytes 1.66 Mbits/sec
- - - - - - - - - - - - - - - - - - - - - - - - -
[ ID] Interval Transfer Bitrate
[ 5] 0.00-10.05 sec 4.94 MBytes 4.12 Mbits/sec receiver
-----------------------------------------------------------
Server listening on 5201
-----------------------------------------------------------
Wait, what? The TCP port is different to what you have seen on the client side (and IP as well). So the beauty of iPerf is that it works fine even if there is a NAT between the client and the server. That creates even more interesting opportunity to you…
How to measure the performance from the server to the client of the client is behind the dynamic NAT/PAT?
The iPerf3 is having an option, which allows you to signal from the client to the server, that the server shall send the data using the TCP session established by the client side. To do that, add the flag “-R“, when you run the test on the client:
2
3
4
5
6
7
8
9
10
11
12
13
14
15
16
17
18
19
Connecting to host 192.168.1.75, port 5201
Reverse mode, remote host 192.168.1.75 is sending
[ 5] local 10.0.2.6 port 49670 connected to 192.168.1.75 port 5201
[ ID] Interval Transfer Bitrate
[ 5] 0.00-1.00 sec 5.80 MBytes 48.7 Mbits/sec
[ 5] 1.00-2.00 sec 5.93 MBytes 49.8 Mbits/sec
[ 5] 2.00-3.00 sec 3.17 MBytes 26.5 Mbits/sec
[ 5] 3.00-4.00 sec 1.48 MBytes 12.4 Mbits/sec
[ 5] 4.00-5.00 sec 1.35 MBytes 11.3 Mbits/sec
[ 5] 5.00-6.01 sec 1.17 MBytes 9.76 Mbits/sec
[ 5] 6.01-7.00 sec 3.44 MBytes 29.1 Mbits/sec
[ 5] 7.00-8.00 sec 4.83 MBytes 40.5 Mbits/sec
[ 5] 8.00-9.00 sec 3.14 MBytes 26.3 Mbits/sec
[ 5] 9.00-10.00 sec 3.37 MBytes 28.3 Mbits/sec
- - - - - - - - - - - - - - - - - - - - - - - - -
[ ID] Interval Transfer Bitrate Retr
[ 5] 0.00-10.03 sec 35.4 MBytes 29.7 Mbits/sec 38 sender
[ 5] 0.00-10.00 sec 33.7 MBytes 28.3 Mbits/sec receiver
As you can see, the speed from our ARM PI 4 to VM with CentOS is 5-10 times higher and the amount of retransmits is 10 times less.
So iPerf gives you possibility to measure the network performance in both directions even if there are some complications to establish the direct connectivity (e.g., NAT).
Let’s try to run test from the Android phone to the Raspberry PI iPerf server:

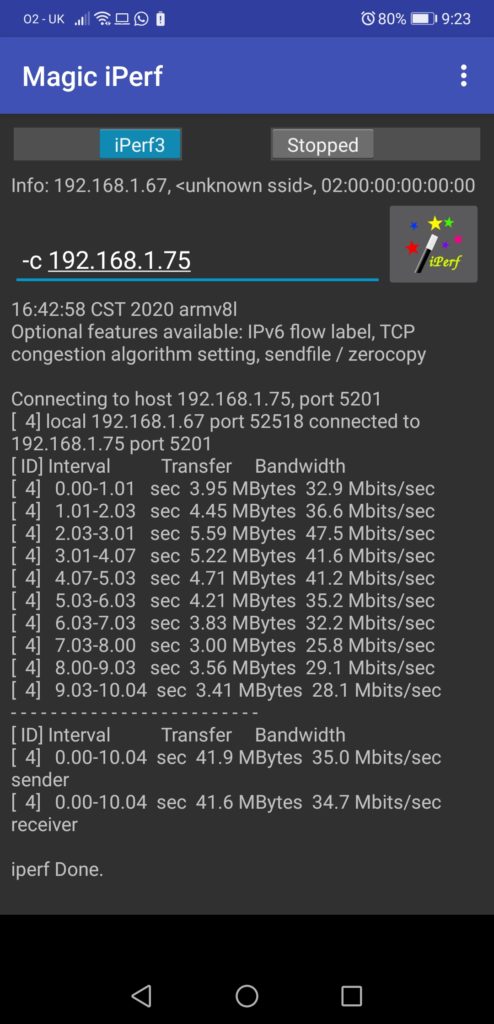
It is exciting, isn’t it? The speed is way better than from VM running CentOS, however we are using the same WLAN connectivity for the uplink. So, you start seeing so that server running VM (in this case, that is my laptop, but still) can be a source of the troubles with the network performance, not the network itself.
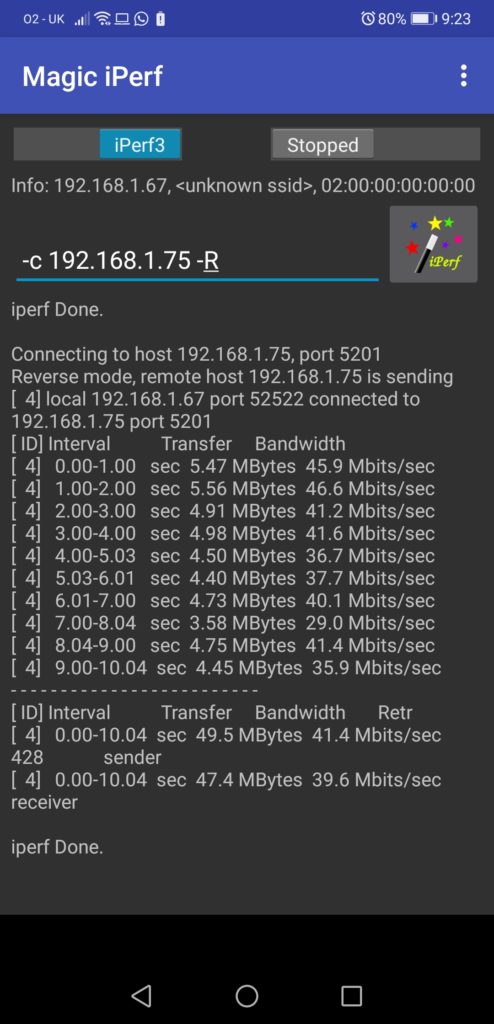
Can we test the performance from the our ARM server (such a sound name for Raspberry PI 4, isn’t it? :-)) to the Android phone? Yes, we can:
Meanwhile, all the results are visible on the server side as explained above as well:
2
3
4
5
6
7
8
9
10
11
12
13
14
15
16
17
18
19
20
21
22
23
24
25
26
27
28
29
30
31
32
33
34
35
36
37
38
39
40
41
42
43
44
45
46
47
48
49
50
51
52
53
54
55
56
57
58
59
60
61
62
63
64
65
66
67
68
69
70
71
72
73
74
75
76
77
78
79
80
81
82
-----------------------------------------------------------
Server listening on 5201
-----------------------------------------------------------
Accepted connection from 192.168.1.66, port 63931
[ 5] local 192.168.1.75 port 5201 connected to 192.168.1.66 port 63932
[ ID] Interval Transfer Bitrate
[ 5] 0.00-1.00 sec 356 KBytes 2.92 Mbits/sec
[ 5] 1.00-2.00 sec 710 KBytes 5.82 Mbits/sec
[ 5] 2.00-3.00 sec 649 KBytes 5.31 Mbits/sec
[ 5] 3.00-4.00 sec 870 KBytes 7.12 Mbits/sec
[ 5] 4.00-5.00 sec 730 KBytes 5.98 Mbits/sec
[ 5] 5.00-6.00 sec 405 KBytes 3.32 Mbits/sec
[ 5] 6.00-7.00 sec 284 KBytes 2.32 Mbits/sec
[ 5] 7.00-8.00 sec 456 KBytes 3.74 Mbits/sec
[ 5] 8.00-9.00 sec 396 KBytes 3.24 Mbits/sec
[ 5] 9.00-10.00 sec 203 KBytes 1.66 Mbits/sec
- - - - - - - - - - - - - - - - - - - - - - - - -
[ ID] Interval Transfer Bitrate
[ 5] 0.00-10.05 sec 4.94 MBytes 4.12 Mbits/sec receiver
-----------------------------------------------------------
Server listening on 5201
-----------------------------------------------------------
Accepted connection from 192.168.1.66, port 64300
[ 5] local 192.168.1.75 port 5201 connected to 192.168.1.66 port 64301
[ ID] Interval Transfer Bitrate Retr Cwnd
[ 5] 0.00-1.00 sec 6.36 MBytes 53.4 Mbits/sec 0 387 KBytes
[ 5] 1.00-2.00 sec 6.96 MBytes 58.4 Mbits/sec 0 650 KBytes
[ 5] 2.00-3.00 sec 3.29 MBytes 27.6 Mbits/sec 0 764 KBytes
[ 5] 3.00-4.00 sec 1.18 MBytes 9.91 Mbits/sec 12 543 KBytes
[ 5] 4.00-5.00 sec 1.74 MBytes 14.6 Mbits/sec 8 411 KBytes
[ 5] 5.00-6.00 sec 954 KBytes 7.82 Mbits/sec 18 298 KBytes
[ 5] 6.00-7.00 sec 3.23 MBytes 27.1 Mbits/sec 0 328 KBytes
[ 5] 7.00-8.00 sec 4.97 MBytes 41.7 Mbits/sec 0 346 KBytes
[ 5] 8.00-9.00 sec 3.48 MBytes 29.2 Mbits/sec 0 355 KBytes
[ 5] 9.00-10.00 sec 3.29 MBytes 27.6 Mbits/sec 0 356 KBytes
- - - - - - - - - - - - - - - - - - - - - - - - -
[ ID] Interval Transfer Bitrate Retr
[ 5] 0.00-10.03 sec 35.4 MBytes 29.7 Mbits/sec 38 sender
-----------------------------------------------------------
Server listening on 5201
-----------------------------------------------------------
Accepted connection from 192.168.1.67, port 52516
[ 5] local 192.168.1.75 port 5201 connected to 192.168.1.67 port 52518
[ ID] Interval Transfer Bitrate
[ 5] 0.00-1.00 sec 3.58 MBytes 30.0 Mbits/sec
[ 5] 1.00-2.00 sec 4.11 MBytes 34.5 Mbits/sec
[ 5] 2.00-3.00 sec 5.65 MBytes 47.4 Mbits/sec
[ 5] 3.00-4.00 sec 4.98 MBytes 41.8 Mbits/sec
[ 5] 4.00-5.00 sec 4.99 MBytes 41.9 Mbits/sec
[ 5] 5.00-6.00 sec 4.21 MBytes 35.3 Mbits/sec
[ 5] 6.00-7.00 sec 3.79 MBytes 31.8 Mbits/sec
[ 5] 7.00-8.00 sec 3.23 MBytes 27.1 Mbits/sec
[ 5] 8.00-9.00 sec 3.41 MBytes 28.6 Mbits/sec
[ 5] 9.00-10.00 sec 3.43 MBytes 28.8 Mbits/sec
[ 5] 10.00-10.09 sec 221 KBytes 20.9 Mbits/sec
- - - - - - - - - - - - - - - - - - - - - - - - -
[ ID] Interval Transfer Bitrate
[ 5] 0.00-10.09 sec 41.6 MBytes 34.6 Mbits/sec receiver
-----------------------------------------------------------
Server listening on 5201
-----------------------------------------------------------
Accepted connection from 192.168.1.67, port 52520
[ 5] local 192.168.1.75 port 5201 connected to 192.168.1.67 port 52522
[ ID] Interval Transfer Bitrate Retr Cwnd
[ 5] 0.00-1.00 sec 5.73 MBytes 48.1 Mbits/sec 0 267 KBytes
[ 5] 1.00-2.00 sec 6.21 MBytes 52.1 Mbits/sec 0 489 KBytes
[ 5] 2.00-3.00 sec 5.65 MBytes 47.4 Mbits/sec 0 735 KBytes
[ 5] 3.00-4.00 sec 5.53 MBytes 46.4 Mbits/sec 0 993 KBytes
[ 5] 4.00-5.00 sec 4.47 MBytes 37.5 Mbits/sec 90 281 KBytes
[ 5] 5.00-6.00 sec 4.48 MBytes 37.6 Mbits/sec 49 107 KBytes
[ 5] 6.00-7.00 sec 4.72 MBytes 39.6 Mbits/sec 63 1.00 MBytes
[ 5] 7.00-8.00 sec 3.35 MBytes 28.1 Mbits/sec 101 666 KBytes
[ 5] 8.00-9.00 sec 4.78 MBytes 40.1 Mbits/sec 21 154 KBytes
[ 5] 9.00-10.00 sec 4.60 MBytes 38.6 Mbits/sec 104 462 KBytes
- - - - - - - - - - - - - - - - - - - - - - - - -
[ ID] Interval Transfer Bitrate Retr
[ 5] 0.00-10.10 sec 49.5 MBytes 41.2 Mbits/sec 428 sender
-----------------------------------------------------------
Server listening on 5201
-----------------------------------------------------------
As you can see, there are no limits in scenarious to measure your network performance. Now it is time to do some more advanced tests.
#3. Advanced tests
#3.1. Client side tricks
There are quite a few parameters you might want to modify in the test, which is depending on what exactly you are going to troubleshoot. For example, you are not sure about the long term stability of the network performance. To observe the possible deviations over the time, you can run the iPerf test for a longer period (e.g., 1 minute, 5 minute, 60 minutes, etc). To do that, you need to use key “-t X“, where X is duration in seconds:
2
3
4
5
6
7
8
9
10
11
12
13
14
15
Connecting to host 192.168.1.75, port 5201
[ 5] local 10.0.2.6 port 45562 connected to 192.168.1.75 port 5201
[ ID] Interval Transfer Bitrate Retr Cwnd
[ 5] 0.00-1.00 sec 639 KBytes 5.23 Mbits/sec 39 14.3 KBytes
!
! SOME OUTPUT IS TRUNCATED FOR BREVITY
!
[ 5] 29.00-30.00 sec 816 KBytes 6.68 Mbits/sec 58 32.8 KBytes
- - - - - - - - - - - - - - - - - - - - - - - - -
[ ID] Interval Transfer Bitrate Retr
[ 5] 0.00-30.00 sec 17.2 MBytes 4.80 Mbits/sec 1242 sender
[ 5] 0.00-30.01 sec 16.9 MBytes 4.73 Mbits/sec receiver
iperf Done.
So far you see that performance is poor, to be frank. That could be related to the network condition (e.g., there is no more free capacity, some links are congested or having errors causing some streams to be dropped) or the operating system issues.
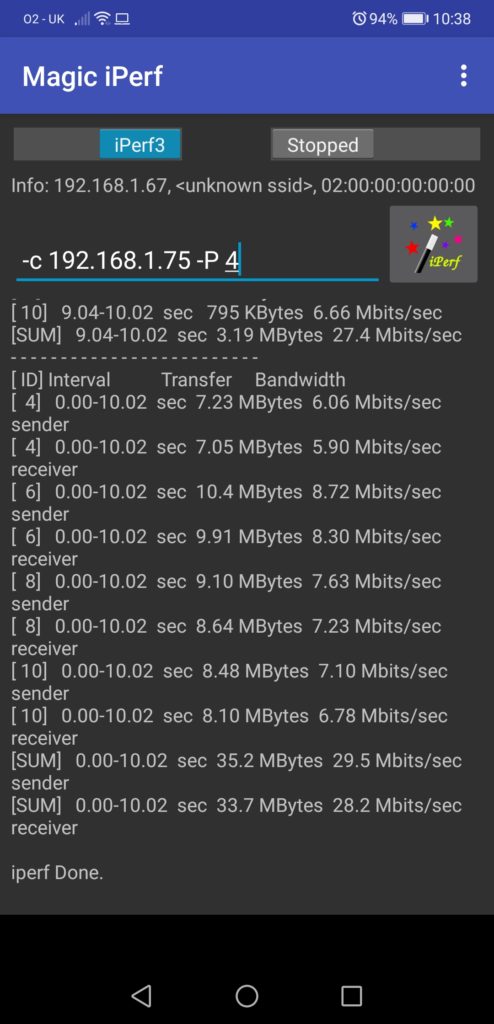
Based on the experience, we’ve seen that sometimes if you have multiple links in your network, where ECMP may happen (data centre fabric, service provider network, etc), you may have sporadic traffic drop for certain flows, what typically means that some one the interface is having issues. One of the ideas, how you can start such a troubleshooting, is to run iPerf measurement simultaneously for several streams in parallel using the “-P X” key, where X is the amount of the parallel streams:
2
3
4
5
6
7
8
9
10
11
12
13
14
15
16
17
18
19
20
21
22
23
24
25
26
27
28
29
30
31
32
33
34
35
36
37
38
39
Connecting to host 192.168.1.75, port 5201
[ 5] local 10.0.2.6 port 45566 connected to 192.168.1.75 port 5201
[ 7] local 10.0.2.6 port 45568 connected to 192.168.1.75 port 5201
[ 9] local 10.0.2.6 port 45570 connected to 192.168.1.75 port 5201
[ 11] local 10.0.2.6 port 45572 connected to 192.168.1.75 port 5201
[ 13] local 10.0.2.6 port 45574 connected to 192.168.1.75 port 5201
[ ID] Interval Transfer Bitrate Retr Cwnd
[ 5] 0.00-1.01 sec 401 KBytes 3.24 Mbits/sec 22 4.28 KBytes
[ 7] 0.00-1.01 sec 412 KBytes 3.33 Mbits/sec 22 4.28 KBytes
[ 9] 0.00-1.01 sec 630 KBytes 5.10 Mbits/sec 42 27.1 KBytes
[ 11] 0.00-1.01 sec 907 KBytes 7.34 Mbits/sec 39 34.2 KBytes
[ 13] 0.00-1.01 sec 519 KBytes 4.20 Mbits/sec 25 4.28 KBytes
[SUM] 0.00-1.01 sec 2.80 MBytes 23.2 Mbits/sec 150
- - - - - - - - - - - - - - - - - - - - - - - - -
!
! SOME OUTPUT IS TRUNCATED FOR BREVITY
!
- - - - - - - - - - - - - - - - - - - - - - - - -
[ 5] 9.00-10.00 sec 110 KBytes 898 Kbits/sec 15 1.43 KBytes
[ 7] 9.00-10.00 sec 125 KBytes 1.03 Mbits/sec 17 1.43 KBytes
[ 9] 9.00-10.00 sec 2.02 MBytes 16.9 Mbits/sec 32 34.2 KBytes
[ 11] 9.00-10.00 sec 1.04 MBytes 8.72 Mbits/sec 48 4.28 KBytes
[ 13] 9.00-10.00 sec 925 KBytes 7.57 Mbits/sec 40 35.6 KBytes
[SUM] 9.00-10.00 sec 4.20 MBytes 35.1 Mbits/sec 152
- - - - - - - - - - - - - - - - - - - - - - - - -
[ ID] Interval Transfer Bitrate Retr
[ 5] 0.00-10.00 sec 2.20 MBytes 1.84 Mbits/sec 181 sender
[ 5] 0.00-10.33 sec 2.04 MBytes 1.66 Mbits/sec receiver
[ 7] 0.00-10.00 sec 2.12 MBytes 1.78 Mbits/sec 192 sender
[ 7] 0.00-10.33 sec 1.98 MBytes 1.60 Mbits/sec receiver
[ 9] 0.00-10.00 sec 8.70 MBytes 7.30 Mbits/sec 345 sender
[ 9] 0.00-10.33 sec 8.50 MBytes 6.90 Mbits/sec receiver
[ 11] 0.00-10.00 sec 9.45 MBytes 7.93 Mbits/sec 346 sender
[ 11] 0.00-10.33 sec 9.31 MBytes 7.56 Mbits/sec receiver
[ 13] 0.00-10.00 sec 9.29 MBytes 7.79 Mbits/sec 350 sender
[ 13] 0.00-10.33 sec 8.90 MBytes 7.22 Mbits/sec receiver
[SUM] 0.00-10.00 sec 31.8 MBytes 26.6 Mbits/sec 1414 sender
[SUM] 0.00-10.33 sec 30.7 MBytes 24.9 Mbits/sec receiver
In the beginning of the output you may see that each stream has obtained its own source port, what in case of multiple paths available in the network will work as a variable for hashing of load-balancing mechanism.

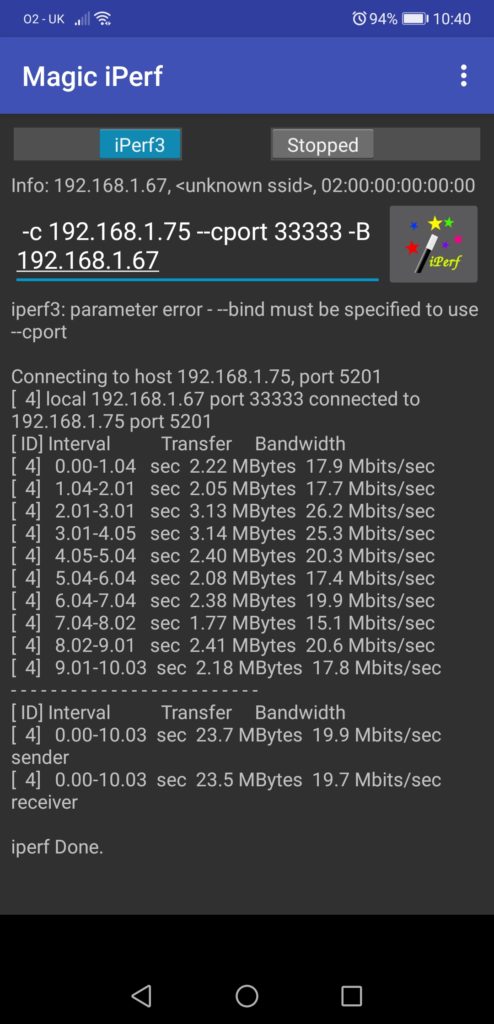
Once you nail down some streams, which are working good or bad, you can retest that using the option to provide a specific port for the TCP session with “–cport X” key, where X is a port number:
2
3
4
5
6
Connecting to host 192.168.1.75, port 5201
[ 5] local 10.0.2.6 port 33333 connected to 192.168.1.75 port 5201
[ ID] Interval Transfer Bitrate Retr Cwnd
[ 5] 0.00-1.00 sec 921 KBytes 7.54 Mbits/sec 41 14.3 !
! FURTHER OUTPUT IS TRUNCATED
In case you have multiple IP addresses (e.g. some secondary IP or just multiple interfaces), you can specify the source IP explicitly using the key “-B X“, where X is a corresponding IP address.
2
3
4
5
6
7
Connecting to host 192.168.1.75, port 5201
[ 5] local 10.0.2.6 port 33333 connected to 192.168.1.75 port 5201
[ ID] Interval Transfer Bitrate Retr Cwnd
[ 5] 0.00-1.00 sec 921 KBytes 7.54 Mbits/sec 41 14.3
!
! FURTHER OUTPUT IS TRUNCATED
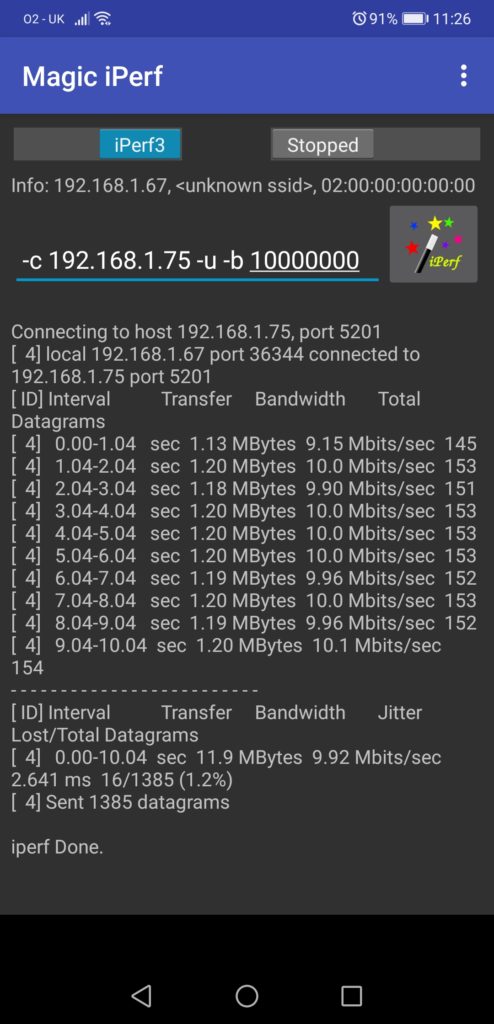
It could be that you are interested in measuring the performance of UDP traffic and the packet loss, if your application in question is UDP based. iPerf gives you such possibility as well, just 2 flags are needed:
- “-u” identifies it will be the UDP traffic
- “-b X” will defined the bandwidth associated. This flag is also working for TCP, but its default behaviour is this: unlimited BW for TCP streams 1 Mbps for UDP.
2
3
4
5
6
7
8
9
10
11
12
13
14
15
Connecting to host 192.168.1.75, port 5201
[ 5] local 10.0.2.6 port 44093 connected to 192.168.1.75 port 5201
[ ID] Interval Transfer Bitrate Total Datagrams
[ 5] 0.00-1.00 sec 1.19 MBytes 9.97 Mbits/sec 855
!
! SOME OUTPUT IS TRUNCATED BY BREVITY
!
[ 5] 9.00-10.22 sec 870 KBytes 5.85 Mbits/sec 610
- - - - - - - - - - - - - - - - - - - - - - - - -
[ ID] Interval Transfer Bitrate Jitter Lost/Total Datagrams
[ 5] 0.00-10.22 sec 11.6 MBytes 9.50 Mbits/sec 0.000 ms 0/8315 (0%) sender
[ 5] 0.00-10.26 sec 11.5 MBytes 9.39 Mbits/sec 1.057 ms 74/8315 (0.89%) receiver
iperf Done.
The important point about the UDP is the fact that the packets are sent doesn’t mean they are received (everyone knows UDP joke, right? :-). Therefore, you should check the server side to validate what was received exactly and how big the packet loss is:
2
3
4
5
6
7
8
9
10
11
12
13
14
Server listening on 5201
-----------------------------------------------------------
Accepted connection from 192.168.1.66, port 63979
[ 6] local 192.168.1.75 port 5201 connected to 192.168.1.66 port 55725
[ ID] Interval Transfer Bitrate Jitter Lost/Total Datagrams
[ 6] 0.00-1.00 sec 1.06 MBytes 8.86 Mbits/sec 0.311 ms 0/759 (0%)
!
! SOME OUTPUT IS TRUNCATED BY BREVITY
!
[ 6] 10.00-10.26 sec 0.00 Bytes 0.00 bits/sec 1.057 ms 0/0 (0%)
- - - - - - - - - - - - - - - - - - - - - - - - -
[ ID] Interval Transfer Bitrate Jitter Lost/Total Datagrams
[ 6] 0.00-10.26 sec 11.5 MBytes 9.39 Mbits/sec 1.057 ms 74/8315 (0.89%) receiver
There are few more things, which you may use depending on your use case:
- You may want to set a specific value of the DSCP bits to validate the network performance for a specific traffic class.
- You can add a level of security to allow only authenticated users to run the performance tests against the server
- You can specify, whether you want to test IPv4 or IPv6
- … and many more
Now, it is time to take a look on the server side, what you can do differently there.
#3.2. Server tricks
In certain cases, you may have a default port (5201 TCP or UDP) not available for you to test (e.g., it is not allowed in the firewall or access-list somewhere, or you want to simulate the performance test for a specific application to take into account load sharing). That’s not a problem, you need start the server part of iperf with the key “-p X“, where X is the port number to be used by TCP or UDP:
2
3
4
-----------------------------------------------------------
Server listening on 11111
-----------------------------------------------------------
Then, on the customer side you need to specify the port the server is listening to using the same key:
2
3
4
5
6
7
8
9
10
11
12
13
14
15
Connecting to host 192.168.1.75, port 11111
[ 5] local 10.0.2.6 port 49184 connected to 192.168.1.75 port 11111
[ ID] Interval Transfer Bitrate Retr Cwnd
[ 5] 0.00-1.00 sec 449 KBytes 3.68 Mbits/sec 18 4.28 KBytes
!
! SOME OUTPUT IS TRUNCATED BY BREVITY
!
[ 5] 9.00-10.00 sec 863 KBytes 7.06 Mbits/sec 57 34.2 KBytes
- - - - - - - - - - - - - - - - - - - - - - - - -
[ ID] Interval Transfer Bitrate Retr
[ 5] 0.00-10.00 sec 9.63 MBytes 8.08 Mbits/sec 394 sender
[ 5] 0.00-10.05 sec 9.42 MBytes 7.86 Mbits/sec receiver
iperf Done.
The second useful tweak you can do on the server is to change mode of the operation of the iPerf server side so that it runs as a daemon in background rather than in foreground. That allows you to create a multipurpose monitoring server, where the iperf could be one of the servers it offers. In the same time, you would like to see the tests run against that and the results of the measurements. As such, you need 2 more keys:
- “-D” will instruct the server to run in the daemon mode.
- “–logfile X“, where X is a file name will point to a file, which will store the output of all the interactions with servers.
Run the following commands on the server side:
2
$
You are getting the CLI back, so you can carry on with any further job you need to do at this server. Meanwhile, you can run the tests from your client:
2
3
4
5
6
7
8
9
10
11
12
13
Connecting to host 192.168.1.75, port 5201
[ 5] local 10.0.2.6 port 45670 connected to 192.168.1.75 port 5201
[ ID] Interval Transfer Bitrate Retr Cwnd
[ 5] 0.00-1.01 sec 609 KBytes 4.96 Mbits/sec 16 4.28 KBytes
!
! SOME OUTPUT IS TRUNCATED BY BREVITY
!
[ 5] 9.00-10.00 sec 1.26 MBytes 10.5 Mbits/sec 38 1.43 KBytes
- - - - - - - - - - - - - - - - - - - - - - - - -
[ ID] Interval Transfer Bitrate Retr
[ 5] 0.00-10.00 sec 13.3 MBytes 11.2 Mbits/sec 345 sender
[ 5] 0.00-10.04 sec 13.2 MBytes 11.0 Mbits/sec receiver
Once the tests are done, you can check on the server side all the details in the log file, which was identified during the launch:
2
3
4
5
6
7
8
9
10
11
12
13
14
-----------------------------------------------------------
Server listening on 5201
-----------------------------------------------------------
Accepted connection from 192.168.1.66, port 49857
[ 6] local 192.168.1.75 port 5201 connected to 192.168.1.66 port 49858
[ 9] local 192.168.1.75 port 5201 connected to 192.168.1.66 port 49859
[ 11] local 192.168.1.75 port 5201 connected to 192.168.1.66 port 49860
[ 13] local 192.168.1.75 port 5201 connected to 192.168.1.66 port 49861
[ 15] local 192.168.1.75 port 5201 connected to 192.168.1.66 port 49862
[ ID] Interval Transfer Bitrate
[ 6] 0.00-1.00 sec 401 KBytes 3.28 Mbits/sec
!
! FURTHER OUTPUT IS TRUNCATED
If you decide to switch off the server, you just need to find the corresponding process using the PID and kill it:
2
3
4
5
6
pi 1529 0.1 0.0 5556 1568 ? Ss 14:02 0:00 iperf3 -s -D --logfile test.txt
pi 1545 0.0 0.0 7348 548 pts/1 S+ 14:12 0:00 grep --color=auto iperf3
$ kill -9 1529
$ ps aux | grep 'iperf3'
pi 1547 0.0 0.0 7348 556 pts/1 S+ 14:13 0:00 grep --color=auto iperf3
As said earlier for the client part, you may add the strict authentication on the server side to make sure that only legitimate clients can perform the measurements, what is particularly useful if you do the test over the public network.
#4. Changing the output format
Finally, after we have covered a lot of various testing scenarios you might be interested into, let’s try to figure out, what are the possible outputs. By default we get the information into the human readable format, but what if we want to build any automated pipeline, where the iPerf tests are conducted automatically and their results are published to dashboard or are analysed by network analytics?
The iPerf has a possibility to provide the result in a JSON format. To do that, you need to add key “-J” on the client side:
2
3
4
5
6
7
8
9
10
11
12
13
14
15
16
17
18
19
20
21
22
23
24
25
26
27
28
29
30
31
32
33
34
35
36
37
38
39
40
41
42
43
44
45
46
47
48
49
50
51
52
53
54
55
56
57
58
59
60
61
62
63
64
65
66
67
68
69
70
71
72
73
74
75
76
77
78
79
80
81
82
83
84
85
86
87
88
89
90
91
92
93
94
95
96
97
98
99
100
101
102
103
104
105
106
107
108
109
110
111
112
113
114
115
116
117
118
119
120
121
122
123
124
125
126
127
128
129
130
131
132
133
134
135
136
137
138
139
140
141
142
143
144
145
146
147
148
149
150
151
152
153
154
155
156
157
158
159
160
161
162
163
164
165
166
167
168
169
170
171
172
173
174
175
176
177
178
179
180
181
182
183
184
185
186
187
188
189
190
191
192
193
194
195
196
197
198
199
200
201
202
203
204
205
206
207
208
209
210
211
212
213
214
215
216
217
218
219
220
221
222
223
224
225
226
227
228
229
230
231
232
233
234
235
236
237
238
239
240
241
242
243
244
245
246
247
248
249
250
251
252
253
254
255
256
257
258
259
260
261
262
263
264
265
266
267
268
269
270
271
272
273
274
275
276
277
278
279
280
281
282
283
284
285
286
287
288
289
290
291
292
293
294
295
296
297
298
299
300
301
302
303
304
305
306
307
308
309
310
311
312
313
314
315
316
317
318
319
320
321
322
323
324
325
326
327
328
329
{
"start": {
"connected": [{
"socket": 5,
"local_host": "10.0.2.6",
"local_port": 49678,
"remote_host": "192.168.1.75",
"remote_port": 5201
}],
"version": "iperf 3.5",
"system_info": "Linux nnat.karneliuk.com 4.18.0-240.1.1.el8_3.x86_64 #1 SMP Thu Nov 19 17:20:08 UTC 2020 x86_64",
"timestamp": {
"time": "Sun, 17 Jan 2021 21:51:50 GMT",
"timesecs": 1610920310
},
"connecting_to": {
"host": "192.168.1.75",
"port": 5201
},
"cookie": "zwrypqz36a2qoqnvv7oan5zef2jsfma2bwi3",
"tcp_mss_default": 1460,
"sock_bufsize": 0,
"sndbuf_actual": 16384,
"rcvbuf_actual": 87380,
"test_start": {
"protocol": "TCP",
"num_streams": 1,
"blksize": 131072,
"omit": 0,
"duration": 10,
"bytes": 0,
"blocks": 0,
"reverse": 0,
"tos": 0
}
},
"intervals": [{
"streams": [{
"socket": 5,
"start": 0,
"end": 1.0023031234741211,
"seconds": 1.0023031234741211,
"bytes": 523328,
"bits_per_second": 4177003.8443944808,
"retransmits": 27,
"snd_cwnd": 5840,
"rtt": 697,
"rttvar": 122,
"pmtu": 1500,
"omitted": false
}],
"sum": {
"start": 0,
"end": 1.0023031234741211,
"seconds": 1.0023031234741211,
"bytes": 523328,
"bits_per_second": 4177003.8443944808,
"retransmits": 27,
"omitted": false
}
}, {
"streams": [{
"socket": 5,
"start": 1.0023031234741211,
"end": 2.0015499591827393,
"seconds": 0.99924683570861816,
"bytes": 578160,
"bits_per_second": 4628766.2214311361,
"retransmits": 39,
"snd_cwnd": 4380,
"rtt": 695,
"rttvar": 117,
"pmtu": 1500,
"omitted": false
}],
"sum": {
"start": 1.0023031234741211,
"end": 2.0015499591827393,
"seconds": 0.99924683570861816,
"bytes": 578160,
"bits_per_second": 4628766.2214311361,
"retransmits": 39,
"omitted": false
}
}, {
"streams": [{
"socket": 5,
"start": 2.0015499591827393,
"end": 3.0012469291687012,
"seconds": 0.99969696998596191,
"bytes": 1236620,
"bits_per_second": 9895958.77252576,
"retransmits": 62,
"snd_cwnd": 4380,
"rtt": 635,
"rttvar": 264,
"pmtu": 1500,
"omitted": false
}],
"sum": {
"start": 2.0015499591827393,
"end": 3.0012469291687012,
"seconds": 0.99969696998596191,
"bytes": 1236620,
"bits_per_second": 9895958.77252576,
"retransmits": 62,
"omitted": false
}
}, {
"streams": [{
"socket": 5,
"start": 3.0012469291687012,
"end": 4.0016889572143555,
"seconds": 1.0004420280456543,
"bytes": 433620,
"bits_per_second": 3467427.2998871827,
"retransmits": 42,
"snd_cwnd": 20440,
"rtt": 577,
"rttvar": 293,
"pmtu": 1500,
"omitted": false
}],
"sum": {
"start": 3.0012469291687012,
"end": 4.0016889572143555,
"seconds": 1.0004420280456543,
"bytes": 433620,
"bits_per_second": 3467427.2998871827,
"retransmits": 42,
"omitted": false
}
}, {
"streams": [{
"socket": 5,
"start": 4.0016889572143555,
"end": 5.0018069744110107,
"seconds": 1.0001180171966553,
"bytes": 321200,
"bits_per_second": 2569296.7787967911,
"retransmits": 27,
"snd_cwnd": 18980,
"rtt": 375,
"rttvar": 126,
"pmtu": 1500,
"omitted": false
}],
"sum": {
"start": 4.0016889572143555,
"end": 5.0018069744110107,
"seconds": 1.0001180171966553,
"bytes": 321200,
"bits_per_second": 2569296.7787967911,
"retransmits": 27,
"omitted": false
}
}, {
"streams": [{
"socket": 5,
"start": 5.0018069744110107,
"end": 6.0002789497375488,
"seconds": 0.99847197532653809,
"bytes": 562100,
"bits_per_second": 4503681.7368152738,
"retransmits": 43,
"snd_cwnd": 18980,
"rtt": 603,
"rttvar": 284,
"pmtu": 1500,
"omitted": false
}],
"sum": {
"start": 5.0018069744110107,
"end": 6.0002789497375488,
"seconds": 0.99847197532653809,
"bytes": 562100,
"bits_per_second": 4503681.7368152738,
"retransmits": 43,
"omitted": false
}
}, {
"streams": [{
"socket": 5,
"start": 6.0002789497375488,
"end": 7.0003120899200439,
"seconds": 1.0000331401824951,
"bytes": 497860,
"bits_per_second": 3982748.0110040833,
"retransmits": 47,
"snd_cwnd": 18980,
"rtt": 328,
"rttvar": 32,
"pmtu": 1500,
"omitted": false
}],
"sum": {
"start": 6.0002789497375488,
"end": 7.0003120899200439,
"seconds": 1.0000331401824951,
"bytes": 497860,
"bits_per_second": 3982748.0110040833,
"retransmits": 47,
"omitted": false
}
}, {
"streams": [{
"socket": 5,
"start": 7.0003120899200439,
"end": 8.0023720264434814,
"seconds": 1.0020599365234375,
"bytes": 481800,
"bits_per_second": 3846476.5025658207,
"retransmits": 37,
"snd_cwnd": 20440,
"rtt": 401,
"rttvar": 113,
"pmtu": 1500,
"omitted": false
}],
"sum": {
"start": 7.0003120899200439,
"end": 8.0023720264434814,
"seconds": 1.0020599365234375,
"bytes": 481800,
"bits_per_second": 3846476.5025658207,
"retransmits": 37,
"omitted": false
}
}, {
"streams": [{
"socket": 5,
"start": 8.0023720264434814,
"end": 9.0017809867858887,
"seconds": 0.99940896034240723,
"bytes": 562100,
"bits_per_second": 4499459.3589188484,
"retransmits": 45,
"snd_cwnd": 18980,
"rtt": 367,
"rttvar": 72,
"pmtu": 1500,
"omitted": false
}],
"sum": {
"start": 8.0023720264434814,
"end": 9.0017809867858887,
"seconds": 0.99940896034240723,
"bytes": 562100,
"bits_per_second": 4499459.3589188484,
"retransmits": 45,
"omitted": false
}
}, {
"streams": [{
"socket": 5,
"start": 9.0017809867858887,
"end": 10.000101089477539,
"seconds": 0.99832010269165039,
"bytes": 449680,
"bits_per_second": 3603493.4990296755,
"retransmits": 35,
"snd_cwnd": 20440,
"rtt": 512,
"rttvar": 324,
"pmtu": 1500,
"omitted": false
}],
"sum": {
"start": 9.0017809867858887,
"end": 10.000101089477539,
"seconds": 0.99832010269165039,
"bytes": 449680,
"bits_per_second": 3603493.4990296755,
"retransmits": 35,
"omitted": false
}
}],
"end": {
"streams": [{
"sender": {
"socket": 5,
"start": 0,
"end": 10.000101089477539,
"seconds": 10.000101089477539,
"bytes": 5646468,
"bits_per_second": 4517128.736581604,
"retransmits": 404,
"max_snd_cwnd": 20440,
"max_rtt": 697,
"min_rtt": 328,
"mean_rtt": 519
},
"receiver": {
"socket": 5,
"start": 0,
"end": 10.016968965530396,
"seconds": 10.000101089477539,
"bytes": 5488788,
"bits_per_second": 4383591.898018321
}
}],
"sum_sent": {
"start": 0,
"end": 10.000101089477539,
"seconds": 10.000101089477539,
"bytes": 5646468,
"bits_per_second": 4517128.736581604,
"retransmits": 404
},
"sum_received": {
"start": 0,
"end": 10.016968965530396,
"seconds": 10.016968965530396,
"bytes": 5488788,
"bits_per_second": 4383591.898018321
},
"cpu_utilization_percent": {
"host_total": 0.49001790646860094,
"host_user": 0.097042513412793963,
"host_system": 0.39299488733331056,
"remote_total": 0.019121696299913209,
"remote_user": 0.00078453336250969687,
"remote_system": 0.018337280850285832
},
"sender_tcp_congestion": "cubic",
"receiver_tcp_congestion": "cubic"
}
}
The major difference here is in the way, how the results are published:
- In the standard output mode, the results are published immediately once they are produced.
- In the JSON format, the results are published once all the tests are complete.
Despite it may have little impact on short-term tests (e.g., 10 seconds), but it will significantly impact the tool you define if you are measuring the performance for a long period of time (e.g. 5 minutes), as the results for JSON encoding will be available after the test is complete.
Learn more about Asible, Python, JSON for the network configuration and troubleshooting in our Network Automation Training.
#5. Ideas for automation
There are few things, you may want to automate with the respect to the iPerf. For example, you may want to run the iPerf regularly each hour and store the results in the form of the JSON files, which names includes the date and timeframe of the execution? If that sounds interesting to you, look for the example below.
Take me to the examplesLessons learned
When we have started creation of this blogpost, we were not even aware that it is possible to install the iperf on the mobile phone and run the performance test using it as a client or even as a service. Despite, for sure, it is just another compute node, quite powerful in all honesty, it was still a bit unexpected. On the other hand, it makes test of the WLAN performance super simple, as all you need to test the speed is literally just in your hand.
Conclusion
We hope we have fulfil our promise and gave you some interesting read about testing the network performance with iperf. The current state of the application allows you to test it in quite a mixed environment with various endpoints. Iperf is a good tool, which allows you to quickly get some insights about the status of your network and could serve as benchmarking to establish the baseline of network health and during troubleshooting to validate the performance and check how your network changes impacts the performance. Take care and good bye.
Support us
P.S.
If you have further questions or you need help with your networks, I’m happy to assist you, just send me message. Also don’t forget to share the article on your social media, if you like it.
BR,
Anton Karneliuk