


Hello my friend,
Some time ago in LinkedIn we announced that we are working on the tool, which will allows you to model and analyse your network. As one of our primary focuses is data centres, we started from there. Despite it is an early stages, but we are happy and proud to introduce you HAWK: Highly-efficient Automated Weapon Kit. For now, this is a collection of the tools for the network management and analysis, but probably later we will put it under a joint hoot of some front-end, who knows…
2
3
4
5
retrieval system, or transmitted in any form or by any
means, electronic, mechanical or photocopying, recording,
or otherwise, for commercial purposes without the
prior permission of the author.
Where is the the border between network automation and software development?
In order to automate any network operation, you need to write a script, even if that is a simple one. On the other hand, any script is a program or software. This means that the creating of the scripts for the network automation is a form of the software development. And it is fun. It is not all the time easy, but this is definitely a way to go. Don’t listen to noise of those who says that you need to have a degree in a computer science to be able to do that. We can do it. So that you can do that as well. Learn with us how to build the working automation solutions for your infrastructure (networks, servers, virtual machines, containers and much more).
At our trainings, advanced network automation and automation with Nornir (2nd step after advanced network automation), we give you detailed knowledge of all the technologies relevant:
- Data encoding (free-text, XML, JSON, YAML, Protobuf)
- Model-driven network automation with YANG, NETCONF, RESTCONF, GNMI.
- Full configuration templating with Jinja2 based on the source of truth (NetBox).
- Best automation programming languages (Python, Bash), configuration management tools (Ansible) and automation frameworks (Nornir).
- Network automation infrastructure (Linux, Linux networking, KVM, Docker).
I recently participated in a training on Nornir with Anton Karneliuk. Highly recommended for all those who want to develop their automation skills.
Juan Pablo Azar Ricciardi @ Network Engineer en Veepee
Moreover, we put all mentions technologies in the context of the real use cases, which our team has solved and are solving in various projects in the service providers, enterprise and data centre networks and systems across the Europe and USA. That gives you opportunity to ask questions to understand the solutions in-depts and have discussions about your own projects. And on top of that, each technology is provided with online demos and you are doing the lab afterwards to master your skills. Such a mixture creates a unique learning environment, which all students value so much. Join us and unleash your potential.
Why have we developed the HAWK?
All the things we are developing and publishing within the Karneliuk.com are the tools we are using ourselves in the daily job of our team or our customers. It means that we are creating network automation tools to solve the real world problems. However, we believe that our problems aren’t unique, what allows you to use what we have created to improve the efficiency of your network operation as well.
So, what is the HAWK?
The HAWK is an acronym for the Highly-efficient Automated Weapon Kit. We strongly believe that networking space is a war zone and to win there, you need to have a reliable and efficient tools. Also, obviously, you need know how to use them 🙂 So, the HAWK is such a tool. Or, to be precise, the collection of tools.
First HAWK’s tool: Data Centre Topology Analyzer and What-if Simulator
We started with the first practical use case. Some time ago one of our colleagues was doing the maintenance in the network, which aim was to bring the new version of the software on the data centre switches. Despite the network is highly redundant, the engineer hasn’t checked the actual status of the BGP connections. That was a mistake, as unfortunately some of the BGP sessions were not operational; therefore, once he started the upgrade, the two parts of the data centres were not able to communicate to each other. Definitely, that was not good at all.
So we started thinking, how we can make sure that we didn’t repeat this mistake again…
One of our key approaches at Karneliuk.com is to create solutions to address the root cause of problems, rather than dealing with consequences. As such, our thoughts went in a direction how to analyse the real network topology, so that we:
- Know in advance what is there real state of BGP peering. It well may be that interfaces are up, but there is something with the links, or just BGP sessions were not properly configured.
- Visualise the actual topology, so that it can be used for the maintenance planning (and also as an evidence for the change management process).
- Simulate the outage of up-to-N nodes (e.g., spine switches within the data centre pod or across multiple pods) simultaneously and check the connectivity between the interested nodes (e.g., between the leafs or between the leafs and borders).
- Based on the results of the simulation provide the easy understandable analysis, which outlines the failure of which nodes, if happens simultaneously, will break the desired connectivity pattern. This report shall be used for planning the maintenances, where the network devices potentially shall be taken out of operation fully (e.g., reboot) or partially (e.g., SFP or cable replacement).
With these ideas in mind, we started working on the HAWK/topology-analyzer logic.
How does the HAWK/topology-analyzer work?
Despite the requirements aren’t necessary the most complicated, there are a few points, which at the very beginning we were not sure how to do, so we started working on the tool’s logic.
#1. What is the inventory?
The very first point, is where to take the data about your devices? Originally we started with a local YAML or JSON file, but quickly figured out that this approach doesn’t scale, as we need to manually populate those files.
Learn how to use the various data types, such as XML, JSON, and YAML at our network automation training.
However, we still plan to add the local inventory for the companies, which have a small infrastructure, we focused on the integration with the NetBox and using it as the primary data source. The approach is simple: in the configuration file you define the name of the data centre from the NetBox, the NetBox URL, and the roles of the devices you would like to pool from the NetBox. As each company may have its own name of the roles, we created a simple mapping table, which maps internal HAWK’s role leaf, spine, border, and aggregate to the lists of names, how the customer named those devices roles in the NetBox. That removes the necessity to modify the internal logic of the script.
The HAWK was created with Cumulus Linux (now NVIDIA) in mind, as that something we are working on a daily basis in the high scale live environment. This on the one hand affects some particular parts of the script, but we put a lot of efforts in the generalisation and these efforts are on-going now as well.
From the NetBox we collect the information about the devices. What is important is that the device:
- have the platform key set (at the moment we support the one, which would have slug “cumulus-linux” (e.g., name “Cumulus Linux“), but we are also working on any device having OpenConfig using pygnmi.
- have the primary_ip key set (for Cumulus Linux, if this parameter is not set, the tool looks for eth0 interface and grabs IP address from there).
#2. How the data is collected?
Instead of analysing the NetBox information (however, we can extend capabilities of the HAWK for that as well), the HAWK collects the information about the interfaces and their IP addresses and BGP sessions from the devices. The good thing about Cumulus Linux is that provides possibility to collect certain information directly in the JSON format, what simplifies it’s parsing. As there might be potentially hundreds (or thousands of the switches), we collect the information asynchronously using AsyncSSH library. This approach allows us to reach the best possible performance with Python.
#3. How the collected data is analysed?
We love math. That’s why, we use math to analyse all the collected data.
First of all, we are creating the network graph using the same approaches we explained earlier in the hyper-scaler data centre series. The graph is built using the real status of the BGP sessions between the devices. Therefore, if some sessions aren’t operational, they won’t be used for the path computation.
For building the graph we are using NetworkX library, which you can learn at our training.
The math graph gives us two important capabilities:
- We can visualise that using some libraries (we use pyvis).
- We can perform the math operations (e.g., check connectivity between the nodes under certain circumstances) using the built-in algorithms from NetworkX or custom created by us.
#4. How does the what-if analysis work?
When we do the modelling, we create a temporary copies of the graphs, so that:
- certain nodes are taken our from the graphs under the rules you need (e.g., up to 3 spines or up to 2 spines and aggregates) and then
- any level of the nesting is possible (from 1 up to N devices). However, obviously, the more devices simultaneously are down, the more computations needs to be done and, therefore, the duration of the execution is growing significantly. We spent a lot of efforts to solve O(n2) problem and are very proud we managed to do that. We do that by maintain the list of the checked combinations and don’t check them again. The simple example would be that:
- Say, we want to check what would happen in the network in terms of the connectivity between leafs if up to 2 spines are down.
- Say, we have 3 spines in the network (who has 3 spines? :-)), but it would be easier to explain.
| Possible combinations | Do we test that |
|---|---|
| spine1 | YES |
| spine2 | YES |
| spine3 | YES |
| spine1, spine2 | YES |
| spine1, spine3 | YES |
| spine2, spine1 | NO (duplication of 4th one) |
| spine2, spine3 | YES |
| spine3, spine1 | NO (duplication of 5th one) |
| spine3, spine2 | NO (duplication of 7th one) |
- As you see, even on such a small scale we do 33% less operations. That number would be even higher if we analyse the outage up to 3 nodes reducing the amount of the computation operations by 50%. This is particularly important if the data centre is huge (e.g., 40 spines with hundreds of leafs).
- You can also model the outage of the particular nodes (e.g., spine1 and spine3 only)
- You can also change the rules of the connectivity checks between nodes (by default we check the connectivity between leafs and from leafs to borders)
Once the analysis is done, you are getting the output showing the analysis of the check, which shows whether there is any issue in the connectivity based on defined rules. The output is delivered to CLI and as html report.
Where can I take the HAWK?
Fair question. By this time you might be bored with our explanations and want to see the HAWK. This project as many other our projects are freely available for you at GitHub:
- Go to https://github.com/karneliuk-com.
- Clone the repo using git clone https://github.com/karneliuk-com.
- Start using (read the next part).
How can I use the HAWK/topology-analyzer?
#1. Inventory
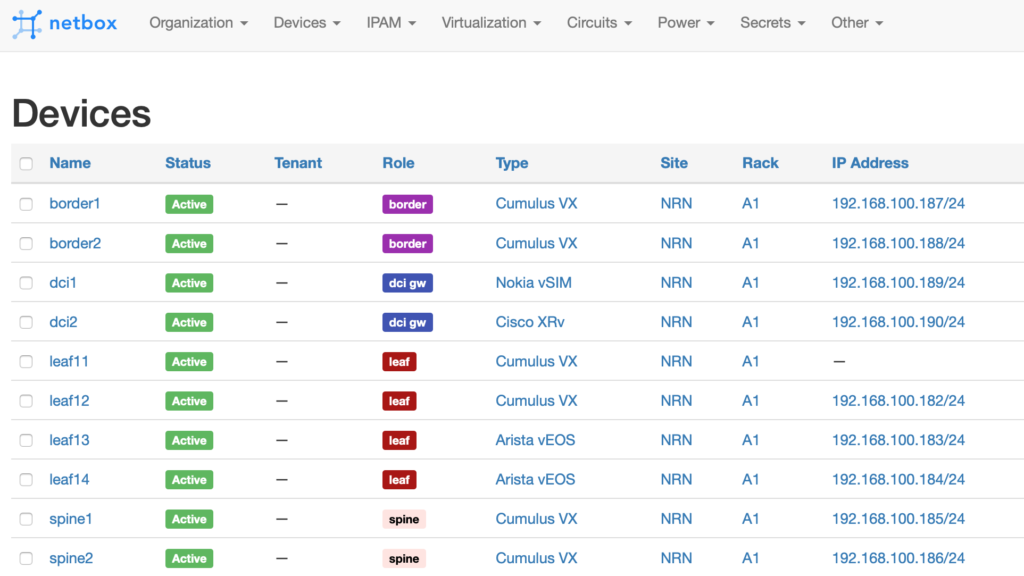
As said earlier, we use the NetBox as the inventory, hence you need to make sure you can access it. Here is the simple example of our topology.

In our training Automation with Nornir you can learn how to use Netbox for network provisioning.
As of now, the HAWK works only with Cumulus Linux, so that it will pull all the devices from the NetBox, but will connect and pull actual data only from the Cumulus-based switches. As you may have noticed, leaf11 doesn’t have primary IP set, which is potential issue. However, the HAWK checks if there is eth0 created, with any IP address assigned, so that the device still can be palled. Also, pay attention to the name of the data centre: it is called “NRN“, what would equal to slug nrn.
#2. Getting the HAWK ready
The preparation is very easy. First of all, make sure you have Python 3.7+ (probably, earlier versions will work either, but we haven’t tested that). Then you need to install all the packages from the requirements.txt file as follows:
Once the modules are installed, modify the config.yaml file:
2
3
4
5
6
7
8
9
10
11
12
13
14
15
16
17
18
19
20
21
22
23
24
25
26
27
28
29
30
31
32
33
34
35
36
37
38
39
40
41
42
43
44
45
46
47
48
49
50
51
52
53
54
55
56
57
58
59
60
61
62
---
# Inventory details for HAWK
inventory:
type: netbox
parameters:
url: http://192.168.1.70:8000
token: 0123456789abcdef0123456789abcdef01234567
site: nrn
# Logging details for HAWK
logging:
enabled: True
parameters:
path: ./log/execution.log
# Output details for HAWK
output:
type: local
parameters:
path: ./output
# Cache details for HAWK
cache:
enabled: True
parameters:
path: ./.cache/raw_results.json
path2: ./.cache/inventory.json
# Templates for HAWK
templates:
parameters:
path: ./templates
# Credentials type
credentials:
type: any
# Device mapping table for builder
mapping:
data_centre:
leaf:
- leaf
spine:
- spine
border:
- border
aggregate:
- aggregate
dci:
- dci-gw
service_provider:
enterprise:
# Command data
commands:
path: ./bin/orders/all.json
# SSH parameters
ssh:
timeout: 20
...
There are two important moments (you can leave others fields default):
- Provide the accurate details for the NetBox connectivity (url and token). If you don’t want to put token in the clear text file, put it to NB_TOKEN environment variable.
- Within the mapping part, perform the mapping of the NetBox roles to the internal HAWK’s roles, where the name of they key mapping.data_centre.leaf is used internally in the HAWK and associated list [“leaf”] is the name of the role within the NetBox. If you have more than one leaf type, just list all of them.
In our Network Automation Training you can learn a lot of details about the YAML and other data encodings.
The last point would to provide the credentials. You have two opportunities:
- You put them as environment variables HAWK_USER and HAWK_PASS (optionally also NB_TOKEN), so that you don’t need to provide them, once you run the script.
- You provide them in CLI once you are asked after you have launched the HAWK.
The last, but not least, make sure that your switches are available:
2
3
4
5
6
7
8
9
10
192.168.100.1
192.168.100.181
192.168.100.182
192.168.100.185
192.168.100.186
192.168.100.187
192.168.100.188
192.168.100.189
192.168.100.190
#3. Visualising the BGP topology
If all above was properly done, you now can use the HAWK to visual your data centre as simple as:
2
3
4
Please, provide the credentials for the network functions and NetBox token:
Username > cumulus
Password >
After a few second (depending how big your DC is), the tool completes its job and you will have a new directory output created, which would have a sub-directory following your time:
2
2021-04-07_21:49:02.855797
Within that directory, you would have an HTML document having your topology. It is generated using pyvis, so it is interactive one and you can explore that:

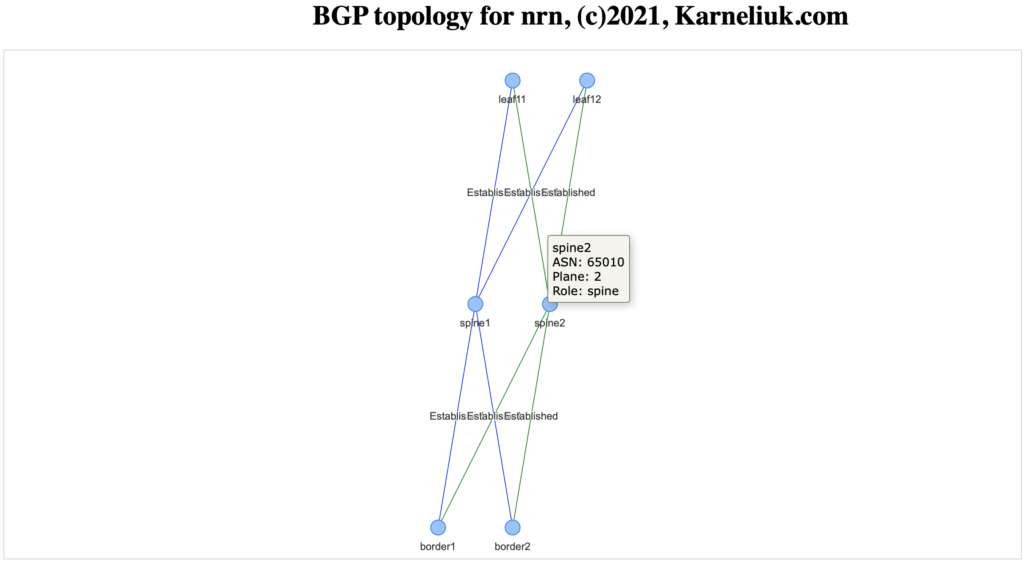
You can move the elements as much as you want. to have a better resolution (as well you can zoom in/out the topology). Once you hover the node, you will see its details.
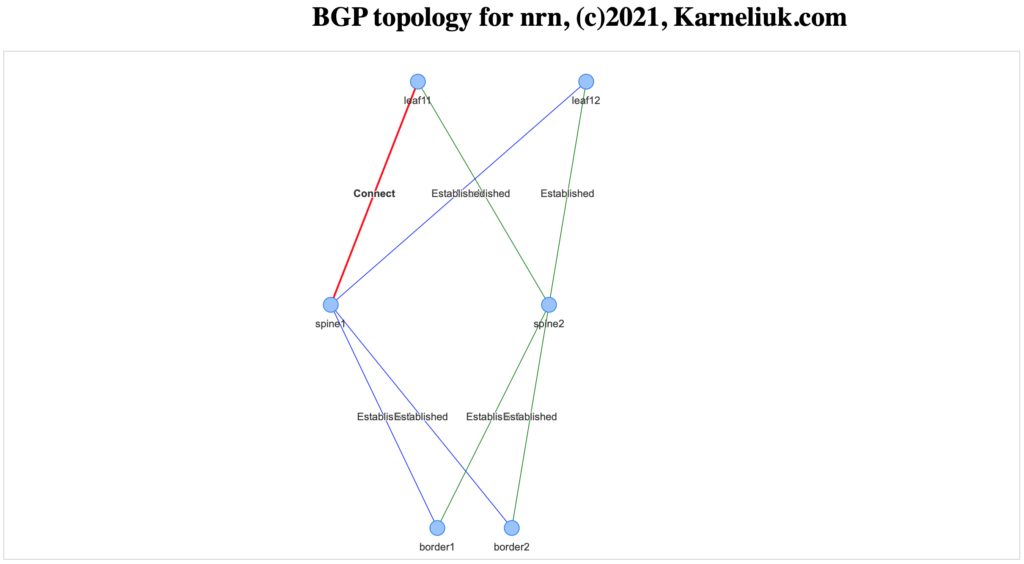
In case the BGP session is not active (e.g., port is operationally down or the session is somewhere admin shut), the session is visualised as red with corresponding state:

#4. What-if analysis
To run the analysis, you need to specify that operation and tell which nodes you would like to bring down. For example, you may want to analyse the failure of the up to 2 spines (keeping in mind the example you see above, where one BGP session is not working):
2
3
4
5
6
7
8
9
10
11
12
13
14
15
16
17
18
19
20
21
22
23
Please, provide the credentials for the network functions and NetBox token:
Username > cumulus
Password >
=======================================================================================================================================================================================================
Running the failure analysis for: nrn
Amount of failed nodes up to: 2
-------------------------------------------------------------------------------------------------------------------------------------------------------------------------------------------------------
Results:
-------------------------------------------------------------------------------------------------------------------------------------------------------------------------------------------------------
Failed nodes: spine1
Connectivity check: PASS
-------------------------------------------------------------------------------------------------------------------------------------------------------------------------------------------------------
Failed nodes: spine2, spine1
Connectivity check: FAIL
-------------------------------------------------------------------------------------------------------------------------------------------------------------------------------------------------------
Failed nodes: spine2
Connectivity check: FAIL
-------------------------------------------------------------------------------------------------------------------------------------------------------------------------------------------------------
Elapsed time: 0:00:00.000345
-------------------------------------------------------------------------------------------------------------------------------------------------------------------------------------------------------
=======================================================================================================================================================================================================
Directly in CLI you are getting response telling whether connectivity check was done. What is the check, by the way? By default, the HAWK seeks for the connectivity between leafs and from leafs to exits, but that is configurable.
As with the drawing, you have the new sub-directory created, where you have the detailed analysis:

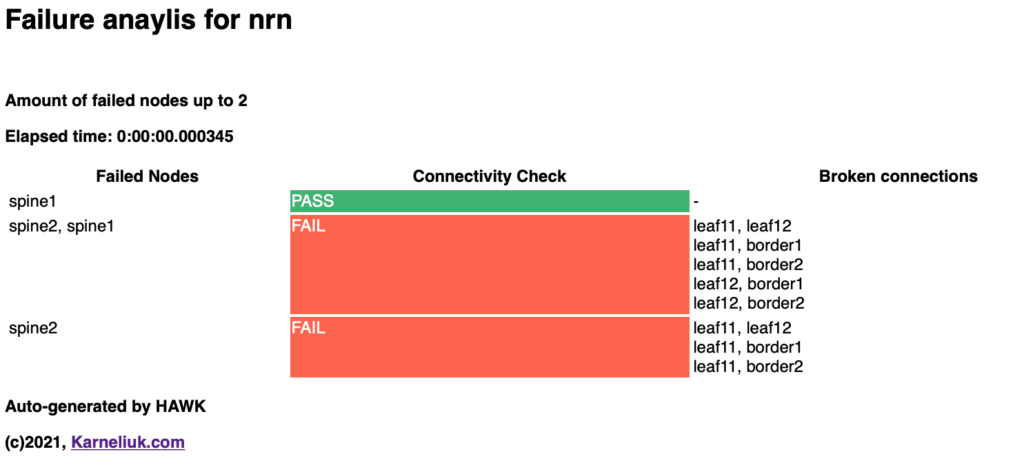
From the detailed report you would see, where are the connectivity issues.
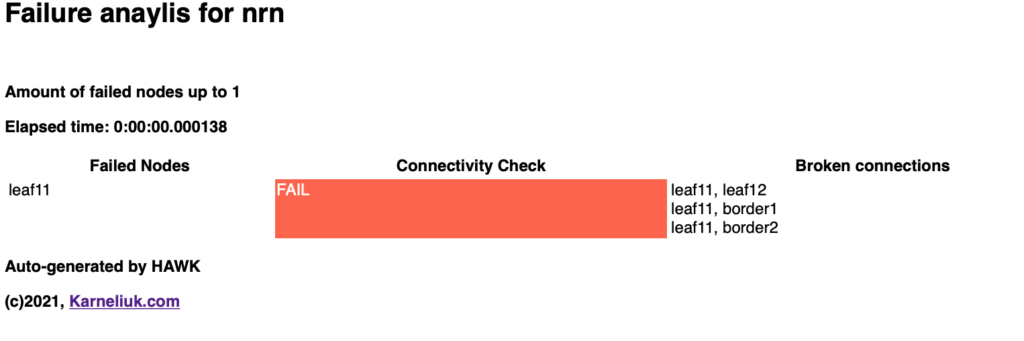
You can also specify the particular node, which failure you would like to analyse:
2
3
4
5
6
7
8
9
10
11
12
13
14
15
16
17
Please, provide the credentials for the network functions and NetBox token:
Username > cumulus
Password >
=======================================================================================================================================================================================================
Running the failure analysis for: nrn
Amount of failed nodes up to: 1
-------------------------------------------------------------------------------------------------------------------------------------------------------------------------------------------------------
Results:
-------------------------------------------------------------------------------------------------------------------------------------------------------------------------------------------------------
Failed nodes: leaf11
Connectivity check: FAIL
-------------------------------------------------------------------------------------------------------------------------------------------------------------------------------------------------------
Elapsed time: 0:00:00.000138
-------------------------------------------------------------------------------------------------------------------------------------------------------------------------------------------------------
=======================================================================================================================================================================================================
Obviously, if leaf11 fails, it won’t be able to communicate :-), but still this is an important test:

#5. Which keys to use?
That’s quite simple, just ask the tool:
2
3
4
5
6
7
8
9
10
11
12
13
14
15
16
17
18
19
20
21
22
23
24
25
26
usage: OpenConfig Network Topology Grapher [-h] [-s] [-l] [-d DATACENTRE] [-f FAILED_NODES] [-ft FAILED_NODE_TYPES] [-fn FAILED_NODE_NAMES] [-ct CHECKED_NODE_TYPES] [-cn CHECKED_NODE_NAMES]
[-o OPERATION] [-t TOPOLOGY]
This tool is polling the info from devices using gNMI using OpenConfig YANG modules and builds topologies.
optional arguments:
-h, --help show this help message and exit
-s, --save Cache the collected information.
-l, --local Use locally stored cache
-d DATACENTRE, --datacentre DATACENTRE
Choose data centre
-f FAILED_NODES, --failed_nodes FAILED_NODES
Number of failed nodes
-ft FAILED_NODE_TYPES, --failed_node_types FAILED_NODE_TYPES
Type of the failed nodes to analyse. Allowed: leaf, spine, aggregate, border
-fn FAILED_NODE_NAMES, --failed_node_names FAILED_NODE_NAMES
Name of the specific nodes, which shall be failed.
-ct CHECKED_NODE_TYPES, --checked_node_types CHECKED_NODE_TYPES
Type of the nodes, which connections shall be checked during simulation. Allowed: leaf, spine, aggregate, border
-cn CHECKED_NODE_NAMES, --checked_node_names CHECKED_NODE_NAMES
Number of specific nodes, which connections shall be checked during simulation.
-o OPERATION, --operation OPERATION
Provide operation type. Allowed: analyze, draw
-t TOPOLOGY, --topology TOPOLOGY
Provide topology type. Allowed: bgp-ipv6, bgp-evpn, lldp, bfd, bgp-ipv4
Some of those keys aren’t yet working (e.g., at the moment only bgp topologies are working, but other visualisations will be available soon.
Can I see how it works?
Subscribe to our YouTube channel. Very soon we will post there quite a few video demos of the HAWK operation.
Lessons Learned
For our team, there were three important insights:
- Every failure is a tremendous opportunity for growth. If something didn’t work well once, it is quite possible it will fail again, if you don’t eliminate the root cause.
- Application of the science for the network modelling and analysis will give you an amazing results, so don’t be scared of experimenting. It is worth it.
- We have learned to create nice, lean and powerful recursive functions in Python, which may help us in other tools as well.
Conclusion
Automation is not only about the configuration of the devices or making a basic reports. It is also about the modelling, testing and triggering the automated tasks. In the near future we’ll create some videos showing the usage of the HAWK, so that you will have a better understanding how to use that. After that we have plans to add some more drivers (e.g., OpenConfig/gNMI). Stay connected, stay tuned. Take care and good bye.
Support us
P.S.
If you have further questions or you need help with your networks, we are happy to assist you, just send us a message. Also don’t forget to share the article on your social media, if you like it.
BR,
Anton Karneliuk