

Hello my friend,
Over the past several articles we have taken a look into the most popular tools for the network troubleshooting. To be precise, we have covered an approach to find your public IP address in a programmable way, how to measure your Internet connectivity speed with Speedtest, how to measure the connectivity speed between your endpoints using iPerf, rapid check of hosts presence in the network with fping, how to check the quality of the path through the network with MTR, and how to see what are in the packets you have in your network. Covering these tools for you and sharing ideas about automation with them led us to creating a new open source tool, which we are happy to share with the community. This time we decided not to think long on its name and just called it the Traceroute Analyzer.
2
3
4
5
retrieval system, or transmitted in any form or by any
means, electronic, mechanical or photocopying, recording,
or otherwise, for commercial purposes without the
prior permission of the author.
What is the network automation?
Network automation is a merger of the networking technologies and the software development. It is possible to start with zero knowledge of the software development, but you should have some networking background. Once you are getting comfortable with basic terms and elements, such as data models or encoding, you gradually will be creating simple and then more complicated tools to boost your networks. The tool is a general term, you can think of Ansible Playbook, or Bash or Python script. The sky is the limit. And that is why you should start your automation journey now with the trusted partner to avoid wasting time going in wrong directions.
That’s what our Live Network Automation Training (10 weeks) and Automation with Nornir (2 weeks) are all about: to show you real automation in a real environment with multiple vendors together. No matter what those vendors are, the automation principles, tools and protocols stay the same and that is what you will learn with us: the full spectre of the automation approaches starting from the text-based automation used in the hyper scalers with the full configuration templated till the model-driven automation with NETCONF/RESTCONF/gNMI loaded with YANG data models for Cisco, Nokia, Arista and Cumulus. This knowledge comes with a lot of different exercises with direct console as well as Ansible/Python and Bash scripts. On top to that, you learn a lot of infrastructure skills such as building and managing Linux, KVM and Docker.
Moreover, we are running our trainings for 2 years already and constantly adopting them to the changes happening in the automation world. Master your automation skills with us.
Brief description
Knowing what is going in the network is a key component both for normal operation and troubleshooting. For automated troubleshooting the JSON data representation is enough; however, for us, humans, the visual representation of the information is quite important. Therefore, we are always looking for the tools, which could help us with that. In the same time, rather than spending a lot of money on the commercial tools, which we anyway would need to tailor to our needs. That thinking led us to the idea, that we can develop a simple and powerful tool, which would rely on some exiting open source projects on the one hand, and in the same time will extend its functionality on the other.
So, what’s the task we are going to solve? There are a few:
- We want to see all the hops we have in transit path between our source node and particular destination
- We want to know which networks (AS’es) the traffic is passing.
- We want to know in which region those IP addresses are located
- We want to see the hop-per-hop latency and loss.
This information would allow us to have a good understanding of the network status and easily represent the state of the traffic to our colleagues, managers and customers. If that sounds interesting to you, take a look how we implement that.
Solution
We could have written our own ICMP stack in Python using the socket from the standard modules. However, our goal is not to practice the Python skills, but to create a solution, which would help us to achieve the goals set above. Therefore, we decided to use the MTR as an info collector for our tool for a few reasons:
- We can easily trigger its execution from Python and collect the result
- The collected results can be in JSON format, what simplify the processing of the data
- It also can provide us information about ASN of the IP address, so that we don’t need to request it in any other source
- Also MTR can do both IPv4 and IPv6 traces
MTR is a single non-Python package we relies on in our tool. Others are our old friends:
| Python Package | Description |
|---|---|
| networkx | Building the math representation of the trace route as a network graph |
| pyvis | Building the responsive HTML file containing the network graph of trace route |
| tqdm | Providing the dynamic visualisation of the iterative processes (loops) in Python |
| yaml | Importing the YAML files and converting them into the Python dictionary |
| folium | Building the responsive HTML file containing the geographical map of the trace route |
The overall algorithm of our Trace Analyzer is look like as follows:

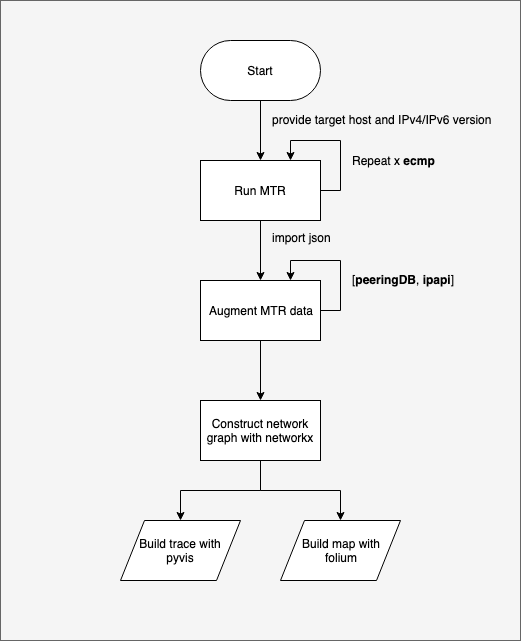
As you can see, the algorithm is relatively simple and straightforward (on a high level, at least). So, let’s see how the tool is working.
Usage
#1. Preparation
Clone the tool from the GitHub and install the relevant packages:
#2. Configuration file
The tools configuration is provided in the config.yml file:
2
3
4
5
6
7
8
9
10
11
12
13
14
15
16
17
18
19
20
21
---
# Amount of possible ICMP paths
ecmp: 2
# Amount of probes sent per one path
probes: 20
# External data sources
datasources:
geo:
url: http://api.ipapi.com
token: your_token
isp:
url: https://peeringdb.com/api
# Saved results
result:
file_map: ./trace_map.html
file_asn: ./trace_isp.html
...
You can put how many potential paths you can have in the network using ecmp value. Each of them will have a random bit pattern in the message body, what would leave to possibility to have different paths across the network, if there are multiple paths available. The probes identifies how many pings we’d send per one path to collect the more granular information.
Then, the key datasources contains the information about geo IP and peering DB data bases, we are using in the tool. For the geo IP, ew are using IPAPI.com as they allow to create a free account.
Finally, in result we provide the name of the files we will store the information in.
#3. Execution
Think about the host you are willing to test the reachability to as well as protocol type: IPv4 or IPv6. Once thought, run the analyzer proving both elements (you can omit them, though: default target is google.com with ipv6 transport):
2
3
4
5
6
7
8
9
Tracing the path to youtube.com over ipv6...
Collecting path info: 100%|████████████████████████████████████████████████████████████| 2/2 [00:55<00:00, 27.95s/it]
Tracing completed.
Augnenting info: 100%|█████████████████████████████████████████████████████████████████| 2/2 [00:02<00:00, 1.08s/it]
Augnenting info: 100%|█████████████████████████████████████████████████████████████████| 2/2 [00:00<00:00, 21.42it/s]
Building topology: 100%|██████████████████████████████████████████████████████████████| 2/2 [00:00<00:00, 477.00it/s]
Drawing the map: 100%|████████████████████████████████████████████████████████████| 14/14 [00:00<00:00, 25675.67it/s]
Time elapsed: 0:00:58.343403
Thanks to tqdm you can see how the progress is looking like. The latter is important for potentially slow activities, such as collecting information from the peering DB or IP API data bases.
#4. Results
The results are produced in the form of the 2 html documents following the naming convention provided earlier in the file config.yml.
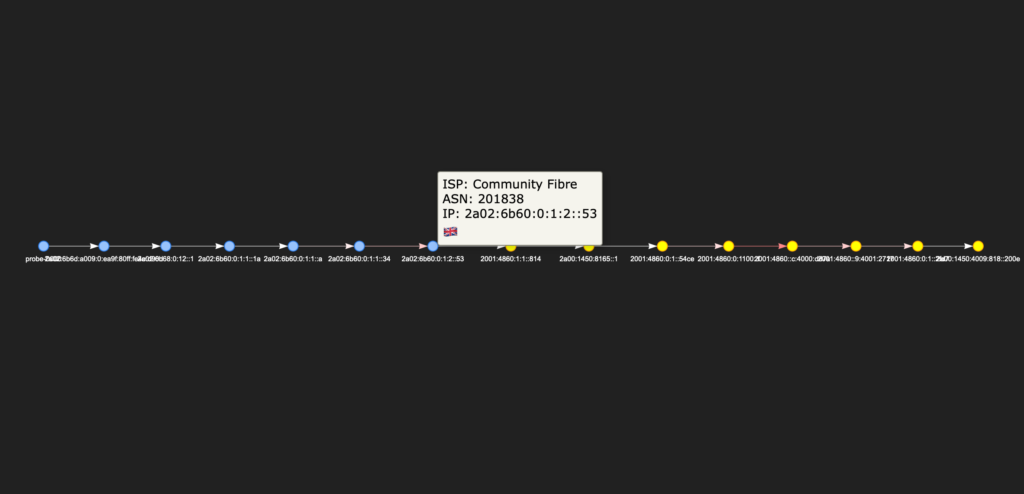
The trace_isp.html contains the dynamic representation, which suggests which path you take till the destination:

The colour coding is the following:
- For hops, we use rounds of different colours. The colour simply means the group of the nodes, what in our case means belonging to a particular transit network (ASN). So in the trace above there are two colours: blue (my home ISP) and yellow (Google).
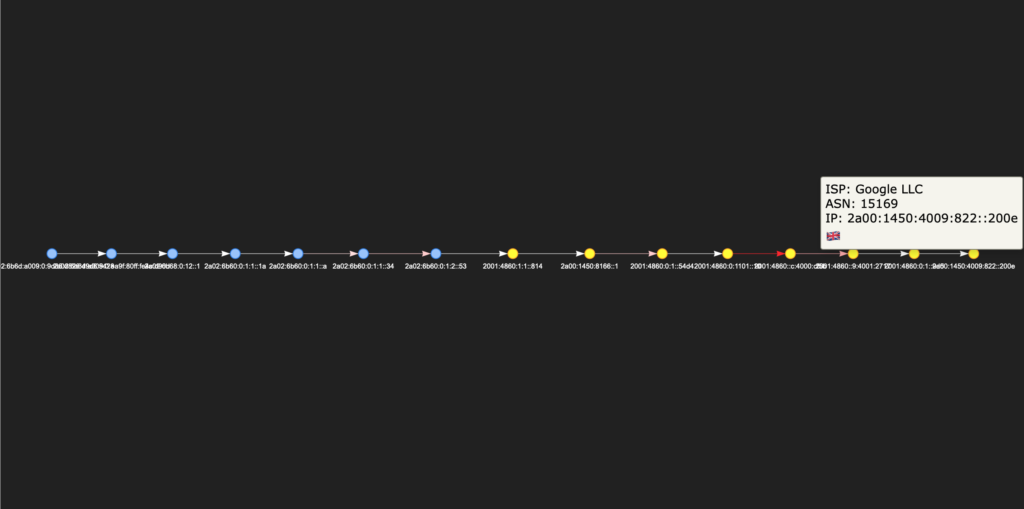
- In the pop up tab you can see the name of ISP, its ASN, IP address and the emoji country flag showing the belonging of IP addresses per the info from IP API GW.
Besides the information provided in the nodes, you can see information about he connectivity up to the hop, which includes latency and loss:

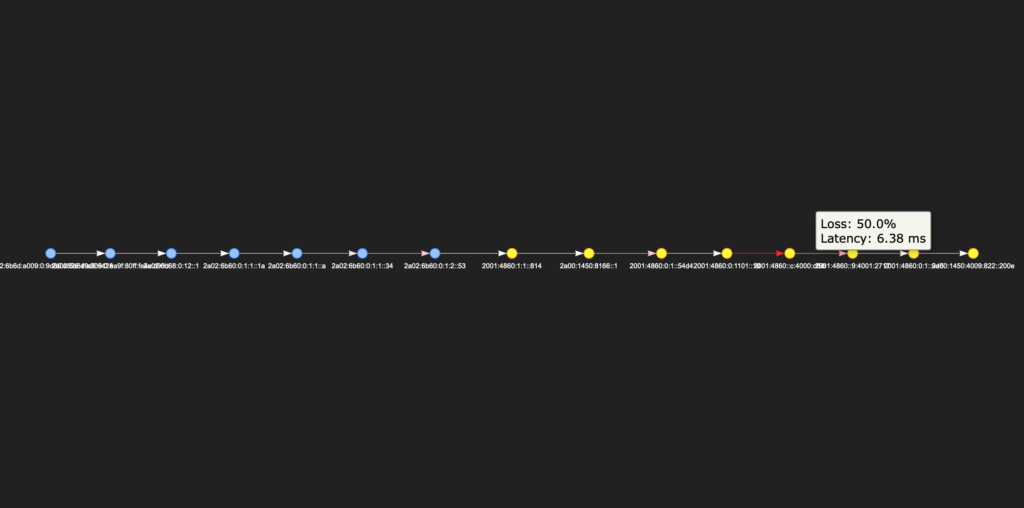
The colour code for links is straightforward: it has 10 shadows of red from white till dark red. The more red the colour is, the more loss the packets experience on links.
The next output is in the file trace_map.html:


Here you can see the geographical distribution of the IP addresses across the world based on the information in IP API database. Here is worth to outline one important point, though: the information in the data base is coming from such data bases as ARIN/RIPE, etc. As such, it might be that certain subnet be associated with US, but in reality hosts be in the Europe (or vice versa). Think about as /24 IPv4 subnet you allocate for point-to-point interfaces between your routers, which may be deployed worldwide.
#5. ECMP
When we were considering multiple options for the trace route: ICMP, UDP, TCP. From our tests we came to conclusion that the the ICMP provides the most accurate view. For example, if we make a trace to YouTube using IPv6, we have such resutlts in terms of hops:
| Protocol | Number of hops |
|---|---|
| ICMP | 11 |
| UDP | 8 |
| TCP | 10 |
As such the ICMP provides the better results, as not all hops might respond to UDP or TCP trace from unknown sources. In the same time MTR has a parameter called bit-pattern, which allows you to control the content of the payload, which helps to influence the load sharing across multiple paths. Here is the example of ECMP’d path:

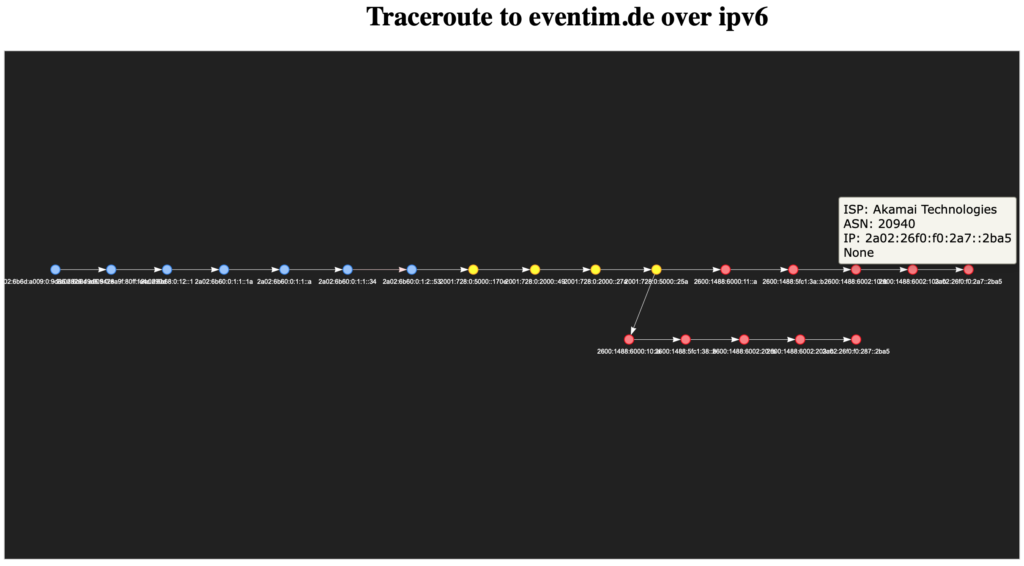
Interestingly enough, you can also see that in the provided case the host is besides Akamai, which is also doing CDN for the destination. MTR makes request for each run (we have parameter ecmp set to 2); therefore, different endpoints are for different runs.
#6. Performance considerations
In order to speed up the execution of the MTRs, we added the caching of the collected results from peering DB and the IP API data bases. Lookup in the local cache not only allows to speed up the build of the results of the traceroute, but also reduces the amount of API calls, which are limited on a free plan in IP API. It is also worth not to misuse the peering DB without excessive need, as that is a key tool for the stability of Internet.
GitHub repo
If you want to grab your copy of the Traceroute Analyzer for free, just go to our GitHub and download it there.
Lessons learned
Quite a few lessons we have learned on the applying DRY principle of the software development. Originally we created 2 separate functions for polling for peering DB and IP API. But then we re-built the tool to have simplified and repetitive function, which is easier to maintain rather than two separate.
Besides that, as usual, we have a lot of interesting insights on the input data validation to make sure that script is working fine and not breaking if some data is missing. For example, IP API responses with all fields back to request about public IP, even if there is no entry, what makes all the keys having null value. Such response requires proper validation in order not to break the visualisation.
Conclusion
We created a tool, which we are actively using ourselves to check the path between the endpoints, once we are reported the problem by our customers. It allows quickly to asses and interpret the data to start troubleshooting as well as to share with customer and non-technical team, where the problems are. Let us know, if that is useful for you as well. Take care and good bye.
Support us
P.S.
If you have further questions or you need help with your networks, our team is happy to assist you. Just book a free slot with us. Also don’t forget to share the article on your social media, if you like it.
BR,
Anton Karneliuk