

Hello my friend,
Right before the New Year we have posted an article, where we introduced a new approach to manage Cumulus Linux, which became available in the latest release to the date Cumulus Linux 5.0. This approach relies on REST API, which makes the automation of this platform very comfortable. Today we’ll cover how to collect the configuration and ope data with the most popular network and infrastructure automation tools these days: Ansible and Python.
2
3
4
5
retrieval system, or transmitted in any form or by any
means, electronic, mechanical or photocopying, recording,
or otherwise, for commercial purposes without the
prior permission of the author.
Ansible or Python? Python or Ansible?
To be absolutely frank, there is no “or”. There is only “and” in such a question. Both Ansible and Python play crucial role in network and infrastructure automation. Both of them are widely used in various companies from small enterprise to gigantic tier-1 web companies (e.g., Google, Amazon, etc). We see different usage patterns, such as Ansible + AWX being a main toolkit, or Python + Stackstorm or Apache Airflow being the main one. At the same time, besides using main toolkits, good engineers try to optimise as much as they can the routine operations to improve the quality of their job and improve the delivery of projects. As such, they develop their own tools with Ansible and Python to automate that routine.
At our automation trainings we teach you core principles of software development for networking and guide you step-by-step through successful algorithms of network operation tools, which assure you don’t break your production systems and implement precisely what you expect them to implement. Moreover, we not only teach you, you start creating such tools yourself during the completion of lab exercises in our training. Enrol today.
We offer the following training programs:
- Zero-to-Hero Network Automation Training
- High-scale automation with Nornir
- Ansible Automation Orchestration with Ansble Tower / AWX
During these trainings you will learn the following topics:
- Success and failure strategies to build the automation tools.
- Principles of software developments and tools for that.
- Data encoding (free-text, XML, JSON, YAML, Protobuf)
- Model-driven network automation with YANG, NETCONF, RESTCONF, GNMI.
- Full configuration templating with Jinja2 based on the source of truth (NetBox).
- Best programming languages (Python, Bash) for developing automation, configuration management tools (Ansible) and automation frameworks (Nornir).
- Network automation infrastructure (Linux, Linux networking, KVM, Docker).
- Orchestration of automation workflows with AWX and its integration with NetBox, GitHub, as well as custom execution environments for better scalability.
Thanks to the excellent presentation of the material, the training was very interesting and productive.
Andei Sokolov @ Skywind Group
Moreover, we put all mentions technologies in the context of real use cases, which our team has solved and are solving in various projects in the service providers, enterprise and data centre networks and systems across the Europe and USA. That gives you opportunity to ask questions to understand the solutions in-depts and have discussions about your own projects. And on top of that, each technology is provided with online demos and labs to master your skills thoroughly. Such a mixture creates a unique learning environment, which all students value so much. Join us and unleash your potential.
Brief Description
Already for a long time, REST API is a de-fact standard for communication between application components these days. Despite it exists on the market already for quite a while (for more than a decade), it is still the most popular framework for such type of things. There are some new emerging frameworks, such as gRCP with Protobuf, which are actively used now in some new applications, such as Kubernetes or gNMI, and with the time they may become even more popular.
However, we firmly believe that in foreseeable future REST API will continue playing its vital role in the application communications worldwide. Apparently, NVIDIA Networking (ex. Cumulus and Mellanox together) thinks the same, that’s why they introduced REST API functionality to manage the network devices in the newest to the date release of there network operation system NVIDIA Cumulus 5.0.
So, what does it offer to us? The best answer to this question we can find in the official data models, which is in this case is an API schema. Take a look at screenshots taken form the official webpage:

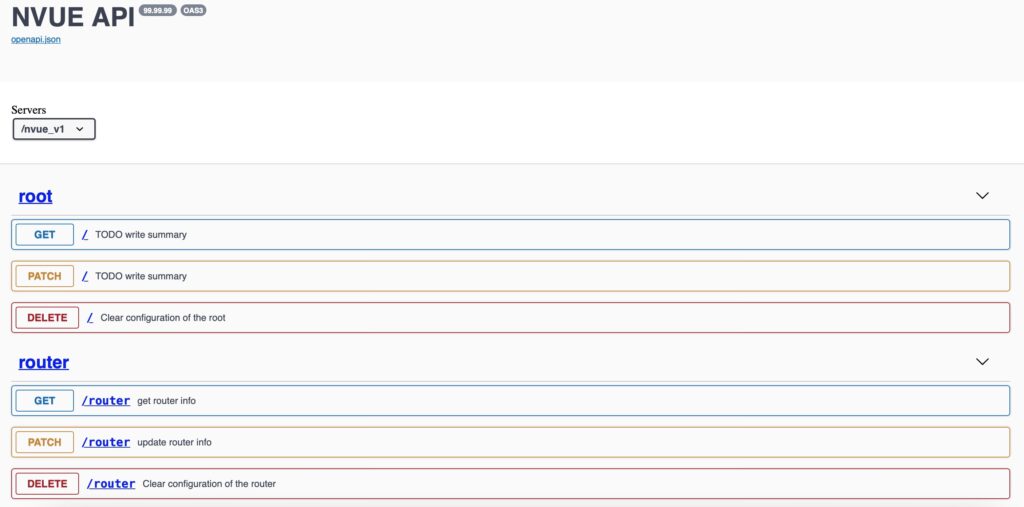

So, what do we see? Well, there are a few important pieces of the information:
- The CRUD endpoints are implemented, but POST and PUT request types are missing.
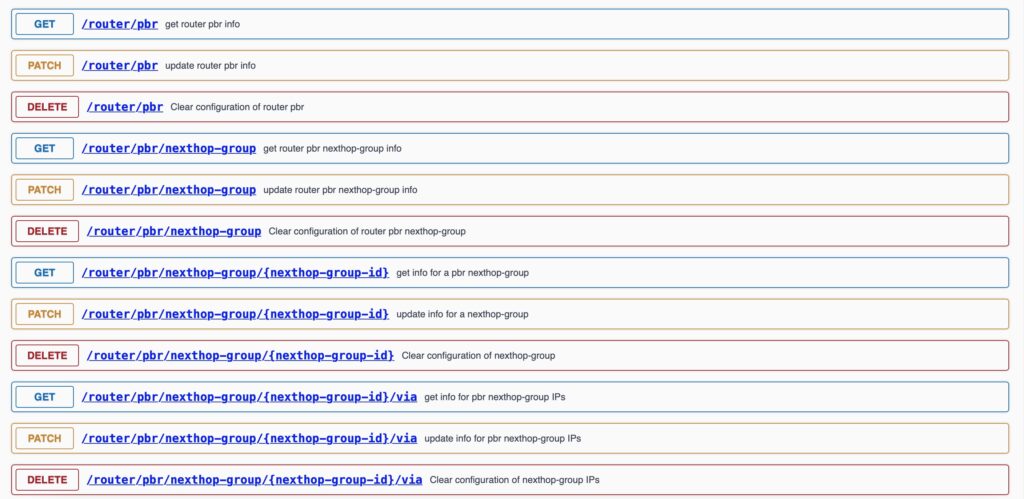
- The are both high-level categories (e.g. /router) and more detailed keys, which allow to manage only a subset of information from the related high-level category (e.g., /router/pbr/nexthop-group/{next hop-group-id})
If you previously worked with NetBox, the API documentation’s structure should be know to you.
Let’s take a look inside the category:

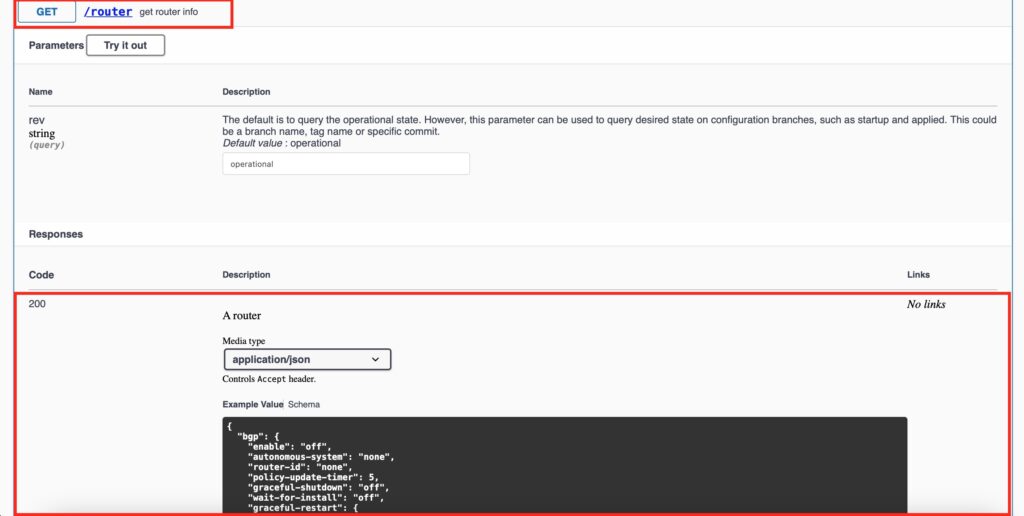
In the screenshot above you could see the beginning of the body, which is in fact the data model:
- It tells which keys are possible within a specific endpoint.
- It provides an insight into which data type is associated with each key (string, integer, float, boolean, object, dictionary, or null).
So far, we have provided where to find documentation about NVIDIA Cumulus REST API so we are ready to start using it.
Read the previous blogpost on the subject to learn how enable REST API gateway on the network device.
Lab Setup
We are going to use the same lab topology we have created in the previous blogpost:

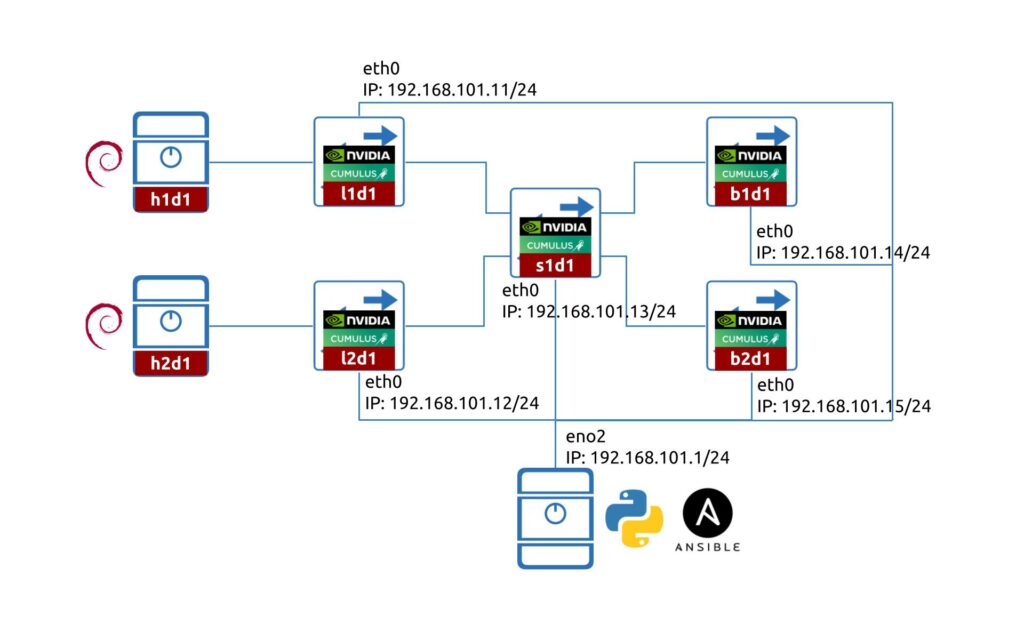
If you want to practice on a smaller scale, one NVIDIA Cumulus VX would be enough.
The lab consist of five switches running NVIDIA Cumulus 5.0:
- 2x leafs (l1d1 and l2d1)
- 1x spine (s1d1)
- 2x border leafs (b1d1 and b2d1)
We also have a management host running Debian 11.1 with:
- Python 3.9
- Ansible
Let’s get started.
Scenario Description
Today we are going to answer the following questions:
- What are the list of the REST API endpoints, which we need to use to backup the full configuration?
- How to collect the information via REST API from NVIDIA Cumulus with Ansible?
Enrol to our Zero-to-Hero Network Automation Training to get a firm grasp on Ansible and Python.
Step #1. Get List of All REST API Endpoints for NVIDIA Cumulus
What we need is to go to the official documentation and collect all the top-level API endpoints:
- /router
- /platform
- /bridge
- /mlag
- /evpn
- /qos
- /interface
- /service
- /system
- /vrf
- /nve
- /acl
- /revision
All, besides the last one, contains the configuration and operational information altogether about your network device running NVIDIA Cumulus. The last one, revision, is used to store information about the configuration revisions, i.e. change sets that can be or was implemented at the network device.
If we want to collect and backup the full configuration, we can just call a root path “/” and it will show all the configurations. It is though not possible to collect all the operational data in such a fashion.
Step #2. Create Ansible Playbook to Poll Data from NVIDIA Cumulus via REST API
It is expected that you know how to install Ansible. Enrol to Zero-to-Hero Network Automation Training to become a professional in Ansible from scratches.
Step #2.1. Files and Folders Structure
For the purpose of this blogpost, we’ll use the following structure for the folders, which is inline with Ansible roles:
2
3
4
5
6
7
8
9
10
11
12
13
14
15
16
17
18
19
+--group_vars
| +--dc-fabric.yaml
+--host_vars
| +--k8f-l1d1.yaml
| +--k8f-l2d1.yaml
+--roles
| +--100.prepare_for_collection
| | +--tasks
| | +--main.yaml
| +--200.collect_data
| | +--tasks
| | +--main.yaml
| +--300.save_data
| +--tasks
| +--main.yaml
+--ansible.cfg
+--hosts
+--main.yaml
Step #2.2. Host_vars and Group_vars
The hosts file for the project looks as follows:
2
3
4
[dc-fabric]
k8f-l1d1
k8f-l2d1
At this stage, we don’t have yet specific configuration per device role (e.g., leaf, spine, border) and, therefore, it is OK to have all the devices just in a single group.
The group_vars for this group is the following:
2
3
4
5
6
7
8
9
10
11
12
---
# Pre-defined data // Connectivity
ansible_user: cumulus
ansible_password: CumulusLinux!
# Custom data // Connectivity
rest_api_port: 8765
# Custom data // Paths
output_dir: output
...
As you can see, we just defined the credentials and some variables, which we would use for all the hosts, such as the directory, where we will store the output and the REST API port for the NVIDIA Cumulus.
You can encrypt the variables with Ansible Vault.
The per-device host_vars is also fairly simple, as we only need to provide IP address, which we will use to connect to the network device:
2
3
4
---
ansible_host: 192.168.101.11
...
Step #2.3. Roles and the Main Playbook
Finally we got the main part of the blogpost from the coding perspective. We have split our playbook in 3 roles, to simplify the scaling in future, if we would need to add more tasks at each of the stages:
- Preparatory tasks before we collect the data from NVIDIA Cumulus.
- Data collection via REST API.
- Saving the collected data.
The first role we define is used to make the necessary preparation on the management host with Ansible before we actually poll the data:
2
3
4
5
6
7
8
---
- name: 100.10. Create output directory
delegate_to: localhost
ansible.builtin.file:
path: "{{ output_dir }}"
state: directory
...
What we are doing here is just a single task: we create locally on the host with Ansible a directory, where we will store the collected information.
The next role is used to collect the data:
2
3
4
5
6
7
8
9
10
11
12
13
14
15
16
17
18
19
20
---
- name: 200.10. Set temp vars
ansible.builtin.set_fact:
creds_plain: "{{ ansible_user }}:{{ ansible_password }}"
url_path: https://{{ ansible_host }}:{{ rest_api_port }}/nvue_v1
url_config_query: "rev=applied"
url_operational_query: "rev=operational"
- name: 200.20. Collect Configuration via REST API
ansible.builtin.uri:
url: "{{ url_path }}/?{{ url_config_query }}"
return_content: yes
method: GET
validate_certs: no
headers:
Content-Type: application/json
Authorization: Basic {{ creds_plain | string | b64encode }}
register: collected_output
...
In the first task we create a bunch of variables, which will be using later:
| Variable | Usage |
|---|---|
| creds_plain | It contains a string value composed in a format username:password, which if encoded in base64 is a default way of authentication against NVIDIA Cumulus REST API. |
| url_path | It contains a string templated with IP address and TCP port for REST API per each host. |
| url_config_query | It contains a string, which will be passed later as a query at REST API to collect only configuration data. |
| url_operational_query | It contains a string, which will be passed later as a query at REST API to collect operational data. It is worth to point out, that we cannot use this query for root or any high-level API endpoints. If you do soo, you will receive 4** error (or no data at all with code 200). |
The second task in the second role is actually the collection of the data. The beauty of REST API is that it is so common in Ansible, that we don’t need to use any network device specific modules. As a parameters for the module ansible.builtin.uri, we specify that:
- We are making the GET request against root endpoint with a query for the config data.
- We expect to receive the content back.
- We skip SSL certificates validation.
- We provide the Authorization and Content-Type headers.
Ultimately, we store the collected output.
The last role saves the collected data in a nice YAML format in the directory created in the first role:
2
3
4
5
6
7
8
---
- name: 300.20. Save collected data
delegate_to: localhost
ansible.builtin.copy:
content: "{{ collected_output.json | to_nice_yaml }}"
dest: "{{ output_dir }}/{{ inventory_hostname }}.yaml"
...
Point out that for all these roles we used only ansible.builtin collection.
Once all the roles are created, we can bring them together in a main.yaml, which we will be calling upon our execution:
2
3
4
5
6
7
8
9
10
11
---
- name: DATA COLLECTION FROM NVIDIA CUMULUS
hosts: dc-fabric
gather_facts: no
roles:
- 100.prepare_for_collection
- 200.collect_data
- 300.save_data
...
Step #3. Use the Created Ansible Playbook
As you have seen, the playbook we’ve created was relatively simple. In fact, we could have created it without roles at all, as it may look now that we have added a lot of extra complexity. However, as said before, it is better to put the proper architecture from the very beginning, rather than to refactor your code later.
Now, let’s test how it works:
2
3
4
5
6
7
8
9
10
11
12
13
14
15
16
17
18
19
20
21
22
PLAY [DATA COLLECTION FROM NVIDIA CUMULUS] **********************************
TASK [100.prepare_for_collection : 100.10. Create output directory] *********
changed: [k8f-l2d1 -> localhost]
ok: [k8f-l1d1 -> localhost]
TASK [200.collect_data : 200.10. Set temp vars] *****************************
ok: [k8f-l1d1]
ok: [k8f-l2d1]
TASK [200.collect_data : 200.20. Collect Configuration via REST API] ********
ok: [k8f-l1d1]
ok: [k8f-l2d1]
TASK [300.save_data : 300.20. Save collected data] **************************
changed: [k8f-l1d1 -> localhost]
changed: [k8f-l2d1 -> localhost]
PLAY RECAP ******************************************************************
k8f-l1d1 : ok=4 changed=1 unreachable=0 failed=0 skipped=0 rescued=0 ignored=0
k8f-l2d1 : ok=4 changed=2 unreachable=0 failed=0 skipped=0 rescued=0 ignored=0
As a result of the playbook execution you can see that all four tasks were successfully completed for two devices, which we have created the the host entries for. You can also check, what actually we did collect from the network devices:
2
3
4
5
6
7
8
9
10
11
12
13
14
15
16
17
18
19
20
21
22
23
24
25
26
27
28
29
30
31
32
33
34
35
36
37
38
39
40
41
42
43
44
45
46
47
48
acl: {}
bridge:
domain:
br_default:
encap: 802.1Q
mac-address: auto
multicast:
snooping:
enable: 'off'
stp:
priority: 32768
state:
up: {}
type: vlan-aware
untagged: 1
vlan:
'20':
multicast:
snooping:
querier:
source-ip: 0.0.0.0
ptp:
enable: 'off'
vni:
'20':
flooding:
enable: auto
mac-learning: auto
'30':
multicast:
snooping:
querier:
source-ip: 0.0.0.0
ptp:
enable: 'off'
vni:
'30':
flooding:
enable: auto
mac-learning: auto
evpn:
dad:
enable: 'off'
enable: 'on'
evi: {}
!
! FURTHER OUTPUT IS TRUNCATED FOR BREVITY
You see now the full configuration file including both the variables we have manually configured beforehand and the default variables. As you can imagine, this is the best way to save the configuration in general or as part of the configuration workflow.
Step #4. Wait, What about Operational Data?
That’s a good question. As said above, it is not possible to poll the operational data for the root “/” or for any top-level endpoints. However, you can do that for a more specific endpoint. Let’s amend our second role a little bit:
2
3
4
5
6
7
8
9
10
11
12
13
14
15
16
17
18
19
!
! OUTPUT IS TRUNCATED FOR BREVITY
!
- name: 200.30. Collect Operational Data via REST API
ansible.builtin.uri:
url: "{{ url_path }}/interface/swp2?{{ url_operational_query }}"
return_content: yes
method: GET
validate_certs: no
headers:
Content-Type: application/json
Authorization: Basic {{ creds_plain | string | b64encode }}
register: operational_data
- name: 200.40. Validate Operational Data
ansible.builtin.debug:
var: operational_data.json
...
As you can see, we have added to the URL the specific interface, we want to collect the operational data for. This time we use the variable url_operational_query, which contains the query for operational data. Afterwards we will just print the the collected output in stdout so that it is visible in the Ansible logs.
Let’s re-run the playbook:
2
3
4
5
6
7
8
9
10
11
12
13
14
15
16
17
18
19
20
21
22
23
24
25
26
27
28
29
30
31
32
33
34
35
36
37
38
39
40
41
42
43
44
45
46
47
48
49
50
51
52
53
54
55
56
57
58
59
60
61
62
63
64
65
66
67
68
69
70
71
72
73
74
75
76
77
78
79
80
81
82
83
84
85
86
87
88
89
90
91
92
93
94
95
96
97
98
99
100
101
102
103
104
105
106
107
108
109
110
111
112
113
114
115
116
117
118
119
120
121
122
123
124
125
126
127
128
129
130
131
132
133
134
135
136
137
138
139
140
141
142
143
144
145
146
147
148
149
PLAY [DATA COLLECTION FROM NVIDIA CUMULUS] **********************************
TASK [100.prepare_for_collection : 100.10. Create output directory] *********
ok: [k8f-l2d1 -> localhost]
ok: [k8f-l1d1 -> localhost]
TASK [200.collect_data : 200.10. Set temp vars] *****************************
ok: [k8f-l1d1]
ok: [k8f-l2d1]
TASK [200.collect_data : 200.20. Collect Configuration via REST API] ********
ok: [k8f-l1d1]
ok: [k8f-l2d1]
TASK [200.collect_data : 200.30. Collect Operational Data via REST API] *****
ok: [k8f-l1d1]
ok: [k8f-l2d1]
TASK [200.collect_data : 200.40. Debug] *************************************
ok: [k8f-l1d1] => {
"operational_data.json": {
"ip": {
"address": {}
},
"link": {
"auto-negotiate": "off",
"duplex": "full",
"mac": "aa:a2:aa:30:77:86",
"mtu": 9212,
"speed": "1G",
"state": {
"up": {}
},
"stats": {
"carrier-transitions": 2,
"in-bytes": 2254248,
"in-drops": 77,
"in-errors": 0,
"in-pkts": 8604,
"out-bytes": 2865662,
"out-drops": 0,
"out-errors": 0,
"out-pkts": 8540
}
},
"lldp": {
"pve-0002.ldn.lab.karneliuk.com": {
"age": "201631",
"bridge": {
"vlan": {}
},
"chassis": {
"capability": {},
"chassis-id": "00:25:90:4e:f5:68",
"management-address-ipv6": "fe80::d8ba:96ff:fe73:3e47",
"system-description": "Debian GNU/Linux 11 (bullseye) Linux 5.11.22-4-pve #1 SMP PVE 5.11.22-8 (Fri, 27 Aug 2021 11:51:34 +0200) x86_64",
"system-name": "pve-0002.ldn.lab.karneliuk.com"
},
"lldp-med": {
"capability": {},
"device-type": "",
"inventory": {}
},
"port": {
"description": "tap188i2",
"name": "ce:fe:90:f6:6b:2e",
"pmd-autoneg": {
"advertised": {},
"autoneg": {},
"mau-oper-type": "10BaseTFD - UTP MAU, full duplex mode"
},
"ttl": 120,
"type": "mac"
}
}
},
"type": "swp"
}
}
ok: [k8f-l2d1] => {
"operational_data.json": {
"ip": {
"address": {}
},
"link": {
"auto-negotiate": "off",
"duplex": "full",
"mac": "26:6e:ef:c7:2b:6d",
"mtu": 9212,
"speed": "1G",
"state": {
"up": {}
},
"stats": {
"carrier-transitions": 2,
"in-bytes": 2254248,
"in-drops": 77,
"in-errors": 0,
"in-pkts": 8604,
"out-bytes": 2865752,
"out-drops": 0,
"out-errors": 0,
"out-pkts": 8541
}
},
"lldp": {
"pve-0002.ldn.lab.karneliuk.com": {
"age": "201631",
"bridge": {
"vlan": {}
},
"chassis": {
"capability": {},
"chassis-id": "00:25:90:4e:f5:68",
"management-address-ipv6": "fe80::d8ba:96ff:fe73:3e47",
"system-description": "Debian GNU/Linux 11 (bullseye) Linux 5.11.22-4-pve #1 SMP PVE 5.11.22-8 (Fri, 27 Aug 2021 11:51:34 +0200) x86_64",
"system-name": "pve-0002.ldn.lab.karneliuk.com"
},
"lldp-med": {
"capability": {},
"device-type": "",
"inventory": {}
},
"port": {
"description": "tap189i2",
"name": "da:d5:05:5c:34:75",
"pmd-autoneg": {
"advertised": {},
"autoneg": {},
"mau-oper-type": "10BaseTFD - UTP MAU, full duplex mode"
},
"ttl": 120,
"type": "mac"
}
}
},
"type": "swp"
}
}
TASK [300.save_data : 300.20. Save collected data] *************************
ok: [k8f-l1d1 -> localhost]
ok: [k8f-l2d1 -> localhost]
PLAY RECAP *****************************************************************
k8f-l1d1 : ok=6 changed=0 unreachable=0 failed=0 skipped=0 rescued=0 ignored=0
k8f-l2d1 : ok=6 changed=0 unreachable=0 failed=0 skipped=0 rescued=0 ignored=0
In this case you see the detailed operational data, such as interface counters and LLDP neighbours.
GitHub Repository
Download this and other examples from our GitHub repository.
Lessons Learned
When we originally started working on this blogpost, we didn’t know the implication of the revision query: operational vs applied. As such, we were not able to collect the information from the top-level CRUD endpoints. This details are not strictly mentioned in the NVUE guide, that operational is a default one. However, in the REST API schema we found it and were able to fix our data collection. Sometimes, in order to find a necessary information you would need to look through a huge amount of information.
Build your own and your network’s stable future with our Network Automation Training.
Conclusion
We originally wanted to cover both Ansible and Python in the same blogpost. However, it already appears to be relatively long, so we will cover the management of NVIDIA Cumulus REST API with Python in a separate blogpost. For now, you can see that it is very easy to retrieve both configuration and operational data from the network device via REST API in a structured format. That is far better than collecting unstructured data and parse it with regular expressions. Take care and good bye.
Support us
P.S.
If you have further questions or you need help with your networks, we are happy to assist you, just send us a message. Also don’t forget to share the article on your social media, if you like it.
BR,
Anton Karneliuk