


Hello my friend,
This is the third and the last (at least for the time being ) blogpost about monitoring of the infrastructure with Prometheus, one of the most powerful and popular open source time series database and metrics collection framework. In today’s talk we’ll cover the build of our own Prometheus exporter, which performs trace route checks.
2
3
4
5
retrieval system, or transmitted in any form or by any
means, electronic, mechanical or photocopying, recording,
or otherwise, for commercial purposes without the
prior permission of the author.
Why to Automate Monitoring?
Many tools nowadays give you possibility not only to collect metrics, but also to act perform a simple )(or complex) analysis and act based on the result of such an analysis. So can Prometheus. With a help of the Alertmanager, it is possible to send a REST API request upon certain condition, which would trigger an automation activity or a workflow to act upon the business logic needed for the condition, such as remediation and/or configuration. This is why you need to know how the network automation works at a good level.
And we are here to assist you with learning the automation skills!
We offer the following training programs:
- Zero-to-Hero Network Automation Training
- High-scale automation with Nornir
- Ansible Automation Orchestration with Ansble Tower / AWX
During these trainings you will learn the following topics:
- Success and failure strategies to build the automation tools.
- Principles of software developments and tools for that.
- Data encoding (free-text, XML, JSON, YAML, Protobuf)
- Model-driven network automation with YANG, NETCONF, RESTCONF, GNMI.
- Full configuration templating with Jinja2 based on the source of truth (NetBox).
- Best programming languages (Python, Bash) for developing automation, configuration management tools (Ansible) and automation frameworks (Nornir).
- Network automation infrastructure (Linux, Linux networking, KVM, Docker).
- Orchestration of automation workflows with AWX and its integration with NetBox, GitHub, as well as custom execution environments for better scalability.
Moreover, we put all mentions technologies in the context of real use cases, which our team has solved and are solving in various projects in the service providers, enterprise and data centre networks and systems across the Europe and USA. That gives you opportunity to ask questions to understand the solutions in-depts and have discussions about your own projects. And on top of that, each technology is provided with online demos and labs to master your skills thoroughly. Such a mixture creates a unique learning environment, which all students value so much. Join us and unleash your potential.
Brief Description
In the previous blogpost about Prometheus we have learned how to use an official Prometheus Blackbox exporter in order to validate the remote resource, such as web service. One of the tests, though, which you are not able to conduct with the Blackbox exporter is a trace route. We were thinking, why such an essential test was not included in the list of the checks available in the Blackbox exporter. And we don’t have an answer. However, we have a theory.
It looks like the Blackbox exporter was created to help the DevOps teams to monitor the reachability of the online resource and its basic user-facing characteristics, such as latency, response code, etc. At the same, trace route is not something that they are really interested into. In fact, some developers hardly understand the infrastructure (no office, network engineers often have no clue how applications work). As a result, trace route is just test that they won’t run against the remote online services. Really, why would you run it if you don’t control Internet entirely?
We faced an interesting scenario, where having the constantly running trace routes helped us to improve stability of the remote connections. Originally, we have just temporary increases in the average requests latency of the remote online service. Both ICMP and HTTP GET tests were showing consistent increase in the average response time. First, we thought that it may be related to the application load. However, the metrics collected from the application itself didn’t show anything suspicious; neither did metrics collected from the VMs shown anything wrong. We thought that having a continuously measured trace route would be an interesting metric to have to access if there are any changes in the network path, which can increase latency.
First of all, we decided to take a look, what exists already in the Prometheus community:
- There is one created in Java Script. Eeeck, Java Script and DevOps are just different worlds.
- There is one integration with RIPE Atlas. It is interesting, if you want to rely on the RIPE Atlas; however, if you build your own monitoring mesh, it is not super useful.
- There is one MTR wrapper. Well, wrapping around CLI tools is quite often a dubious idea. Not so long ago we have faced a problem with running MTR in a Docker container (Alpine) on a Linux hosts (we tested both Debian and CentOS), which resulted in literally thousands of stale processes, which, as a consequence, crashed that container.
We were not impressed by capabilities of the existing Prometheus exporters, so we have decided to create our own.
Use Case
Following the same logic we have introduced in the previous blogpost about Prometheus, we want to:
- Constantly run trace route against the number of the endpoints remotely accessible over the Internet.
- Store in the Prometheus database the number of the hops measured during the trace route measurement.
- Be able to signal, which destinations shall be monitored from the Prometheus host itself, without any local configuration on the exporter side itself (if possible).
Solution Description
We are repeating the topology we have created the last time, with a single difference: we are using now our own Prometheus exporter, which is collecting the trace route:

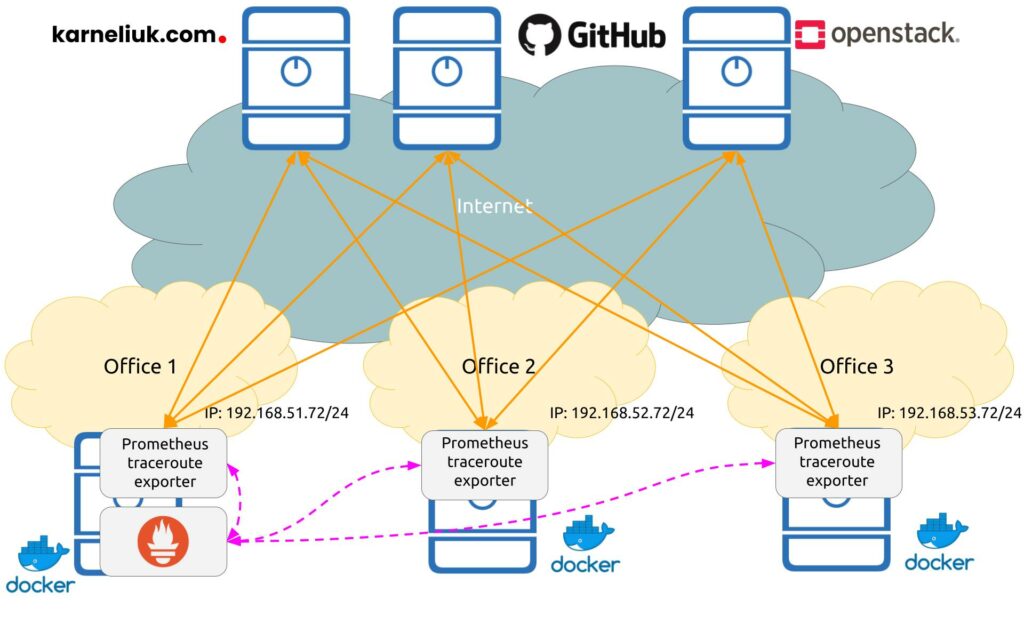
In the previous two blogposts we have shared how to setup the prometheus to interact with already created exporters. So, the communication patterns are the same:
- Orange solid lines show the monitoring flows (trace routes) between Prometheus traceroute exporters and the monitored targets.
- Dashed violet lines show the control plane flows between Prometheus backend and Prometheus traceroute exporters.
Enrol to our Zero-to-Hero Network Automation Training to learn how to use Docker and create your own containerised automation.
Implementation Details
The main focus of this blogpost is to share some insights, how we build our exporter and why we did it in that way.
Step #1. Develop Prometheus Exporter
In our Zero-to-Hero Network Automation Training, which we encourage you to enrol to, we are sharing a lot of real-world scenarios, how Python is used in network automation scenario. We also share the principles of the software design for infrastructure (network, server, etc) projects. Leveraging that knowledge, we decided to use Python to build our own Prometheus exporter.
Become Network Automation Expert with us and build your own applications.
Step #1.1. Mode of Operation
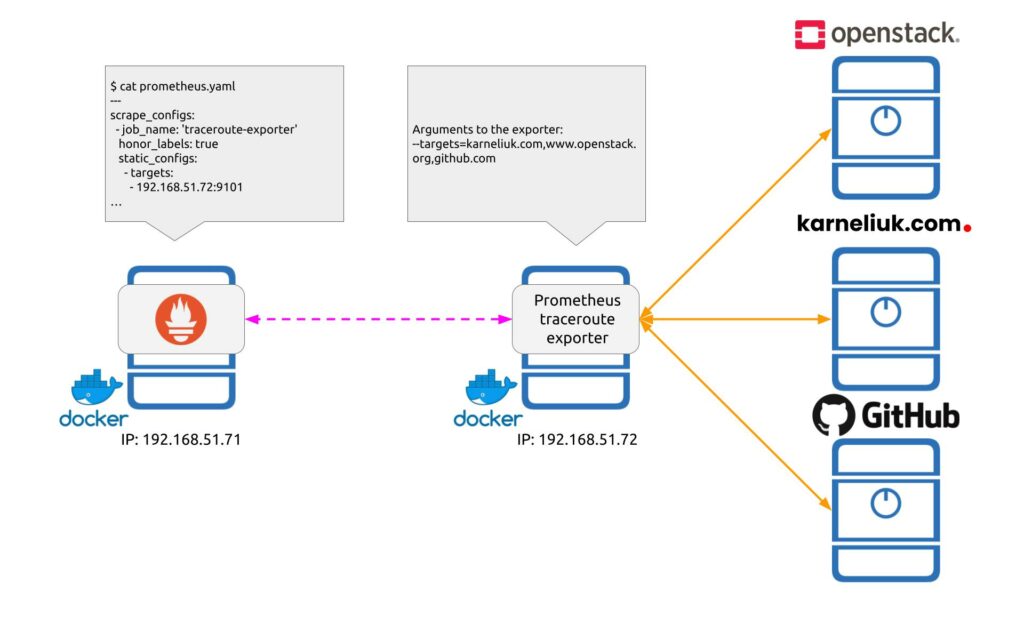
First thing, that we were to solve is the mode of operation. Strictly speaking, there are two possibilities:
- Static targets. In this mode you define in the exporter configuration, what it needs to collect. The configuration file is local to the exporter, which creates an extra administrative overhead for maintenance of such targets. However, this drawback can be neglected if the rollout of the exporter’s configuration is done using some configuration tool (e.g., Ansible). Such a mode for exporter is very easy to implement, though.
Master Ansible skills with our Zero-to-Hero Network Automation Training
- Dynamic targets. In this mode you define the targets, which are to be polled by the exporter inside the Prometheus configuration, which makes maintenance of the exporter’s configuration much simpler. However, the complexity of the code for the exporter itself is much higher.
We tried to summarise both modes in the following table:
| Category | Static targets | Dynamic targets |
|---|---|---|
| Location of targets | Exporter config | Prometheus config |
| Polling of targets | Asynchronously to Prometheus’s scrapes | Upon the Prometheus’s scrape |
| Concurrency | Possible to implement any mode: threading, multiprocessing, async | Sequential as Prometheus requests metrics for each metric one by one |
| Complexity | Low | Medium to high |
| Operational overhead | Medium | Low |
We decided to implement both modes, as some of them may be useful in different circumstances. In fact, jumping ahead, during some different infrastructure setups, we figured out that the second mode can be significantly slower due to various reasons (e.g., presence or absence of application firewall running on the host with Docker, etc).
Here is how it works:
And:
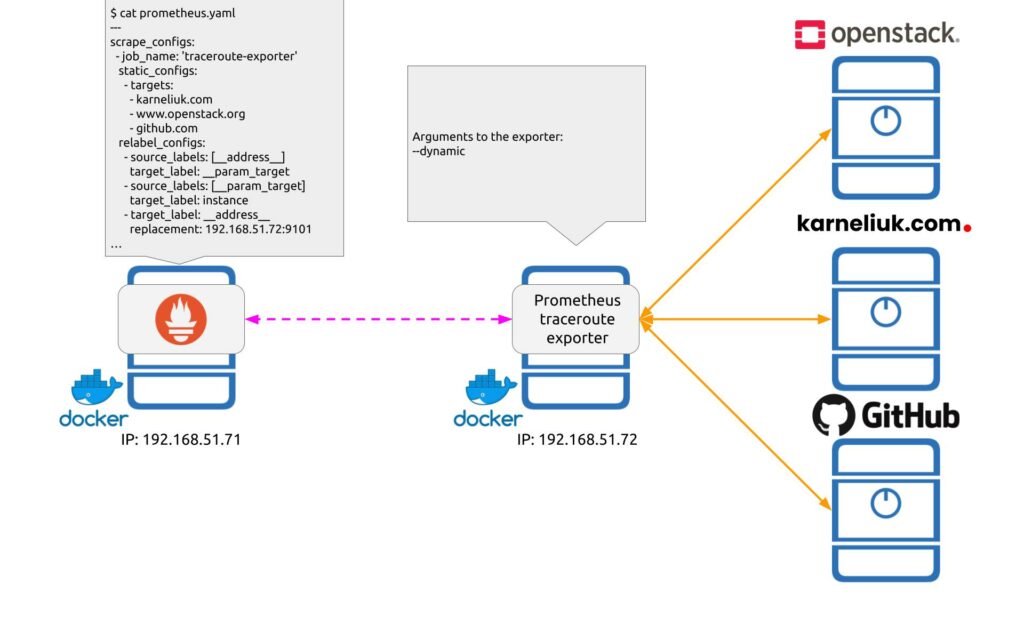
Step #1.2. How to Pass Targets from Prometheus Dynamically
As you can see from provided diagrams, we achieve the dynamic configuration of the exporter from the Prometheus side using the relabelling functionality. The relabelling functionality works in a way that Prometheus, when it performs scrapping of metrics from the device, passes an argument target with a value of each element provided in static_configs[0][targets] list. For example, see the output from the Prometheus Traceroute Exporter working in the dynamic mode:
2
3
2022-04-25T21:52:34.441181995Z 192.168.51.71 - - [25/Apr/2022 21:52:34] "GET /probe?target=github.com HTTP/1.1" 200 700
2022-04-25T21:52:35.721759341Z 192.168.51.71 - - [25/Apr/2022 21:52:35] "GET /probe?target=karneliuk.com HTTP/1.1" 200 703
Looking at timestamps, you can see that requests are sent one after another, about the completion of the previous one.
The tricky thing to solve was to use the subtract and process the passed argument on the Prometheus exporter side. Out of the box, the official Python Prometheus client doesn’t have such a functionality. As such, the extra middleware is needed. By middleware we mean some web service. We decided not to overcomplicate setup by adding extra dependency, such as Flask or FastAPI, and used the WSGI (Web Server Gateway Interface) library, which is a part of a standard Python distribution.
It allowed us implement a logic, which calls a Prometheus exporter service, when the corresponding route (URL) is hit. It also allowed us to parse the parameters of the API call, and, as a result, act upon it using the parameters.
For reference, here is the code of the entire Python Prometheus exporter:
2
3
4
5
6
7
8
9
10
11
12
13
14
15
16
17
18
19
20
21
22
23
24
25
26
27
28
29
30
31
32
33
34
35
36
37
38
39
40
41
42
43
44
45
46
47
48
49
50
51
52
53
# Modules
from wsgiref.simple_server import make_server
from urllib.parse import parse_qs
from prometheus_client import make_wsgi_app
from prometheus_client.core import GaugeMetricFamily, REGISTRY
import os
import jinja2
# Classes
class DynamicTargetExporter(object):
def __init__(self, args, application_port: int, path_default_page: str):
self._args = args
self._application_port = application_port
self._path_default_page = path_default_page
# Prometheus metrics
self._metrics_app = make_wsgi_app()
REGISTRY.register(CustomCollector())
def start(self):
# WSGI server
httpd = make_server("", self._application_port, self._middleware_wsgi)
httpd.serve_forever()
def _middleware_wsgi(self, environ, start_response):
if environ["PATH_INFO"] in {"/probe", "/metrics"}:
query_parameters = parse_qs(environ["QUERY_STRING"])
if query_parameters:
try:
os.environ["PROMETHEUS_TARGET"] = query_parameters["target"][0]
except (IndexError, KeyError) as e:
print(f"Failed to identify target: {e}. Using 'localhost' as destination.")
os.environ["PROMETHEUS_TARGET"] = "localhost"
return self._metrics_app(environ, start_response)
template = jinja2.Template(open(self._path_default_page, "r").read())
rendered_page = template.render(args=self._args)
response_body = str.encode(rendered_page)
response_status = "200 OK"
response_headers = [
('Content-Type', 'text/html'),
('Content-Length', str(len(response_body)))
]
start_response(response_status, response_headers)
return [response_body]
Step #1.3. Performing Traceroute Measurement
The last piece in our journey of building exporter, was a mechanism to conduct the traceroute measurement itself. For that, we used a ready icmplib library, which offers a pure Python implementation of there traceroute and ping functionality. We wrapped into a custom class needed for the Prometheus scrapping:
2
3
4
5
6
7
8
9
10
11
12
13
14
15
16
17
18
19
20
21
22
23
24
25
26
27
28
29
30
31
32
33
34
35
36
37
# Modules
from prometheus_client.core import GaugeMetricFamily, REGISTRY
import icmplib
import time
# Classes
class CustomCollector(object):
def collect(self):
# Set target
target = os.getenv("PROMETHEUS_TARGET") if os.getenv("PROMETHEUS_TARGET") else "localhost"
# Perfrom measurement
try:
timestamp_start = time.time()
measured_hops = len(icmplib.traceroute(target))
timestamp_finish = time.time()
is_successfull = 1
except icmplib.exceptions.NameLookupError:
timestamp_finish = time.time()
measured_hops = 0
is_successfull = 0
# Report metrics
yield GaugeMetricFamily("probe_success",
"Result of the probe execution",
is_successfull)
yield GaugeMetricFamily("probe_traceroute_hops_amount",
"Amount of hops towards destination host",
measured_hops)
yield GaugeMetricFamily("probe_execution_duration_seconds",
"Duration of the measurement",
timestamp_finish - timestamp_start)
Find all the details of this exporter in our Github repository.
Step #2. Host with Exporter
Once the Prometheus Exporter was developed with a Python and we have published it to the GitHub Container Registry using GitHub Action (CI/CD pipeline), we are able to deploy a new Prometheus Traceroute Exporter anywhere.
We are showing the Dynamic Targets Exporter mode. Refer to the GitHub repository for a Static example.
Step #2.1. Traceroute Exporter Docker-compose File
We have published two Docker images: for x86_64 architecture and for arm32v7, what runs on Raspberry PI (yes, you can code even from PI). As such, the docker-compose.yaml contains the filed for the architecture:
2
3
4
5
6
7
8
9
10
11
12
13
14
15
16
17
18
19
20
21
version: "3.9"
services:
traceroute_exporter:
image: "ghcr.io/akarneliuk/traceroute-exporter:${PLATFORM}"
privileged: true
healthcheck:
test:
- "CMD"
- "curl"
- "-f"
- "http://localhost:9101"
interval: 1m
timeout: 10s
retries: 3
start_period: 30s
ports:
- "9101:9101"
command:
- "--dynamic"
...
Step #2.2. Launch Docker Container with Prometheus Traceroute Exporter
As the docker-compose.yaml includes variables you need to launch it accordingly:
Such a launch will create a valuable with a platform type and pass it to the docker-compose tool. We also added the health check in the container to make sure it operates properly in order to bring it down, if something crashed in the app:
2
3
CONTAINER ID IMAGE COMMAND CREATED STATUS PORTS NAMES
1a92941a5b5d ghcr.io/akarneliuk/traceroute-exporter:x86_64 "python3 main.py --d…" 2 days ago Up 2 days (healthy) 0.0.0.0:9101->9101/tcp, :::9101->9101/tcp python-traceroute-exporter_traceroute_exporter_1
You can see that the image name contains the platform, what suggests it was pulled and used properly to match your platform.
Step #3. Host with Prometheus
Refer to the previous blogpost for a detailed information.
Step #3.1. Prometheus Configuration File
As explained above, as we rely on the relabelling, the key part is to include relabelling in the Prometheus job in the prometheus.yaml configuration file:
2
3
4
5
6
7
8
9
10
11
12
13
14
15
16
17
18
19
20
21
22
23
!
! OUTPUT IS TRUNCATED FOR BREVITY
!
scrape_configs:
!
! OUTPUT IS TRUNCATED FOR BREVITY
!
- job_name: 'prometheus python traceroute exporter'
metrics_path: /probe
static_configs:
- targets:
- karneliuk.com
- github.com
- www.openstack.org
relabel_configs:
- source_labels: [__address__]
target_label: __param_target
- source_labels: [__param_target]
target_label: instance
- target_label: __address__
replacement: 192.168.51.72:9101
...
The key fields here are:
- metrics_path has a value “/probe“, which is different to a default one “/metrics“.
- static_configs include targets with a list of hosts to run traceroute against.
- relable_configs contains the target IP address and a port of the exporter running traceroute.
Step #3.2. Start or Restart Prometheus
The docker-compose.yaml file for Prometheus isn’t changed since the previous blogpost. As such, you just need to re-start the container with it:
Check that it is properly started afterwards:
2
3
4
[sudo] password for aaa:
CONTAINER ID IMAGE COMMAND CREATED STATUS PORTS NAMES
1e2db6eda83a prom/prometheus "/bin/prometheus --c…" 8 days ago Up 26 hours 0.0.0.0:9090->9090/tcp, :::9090->9090/tcp prometheus_prometheus_1
Validation
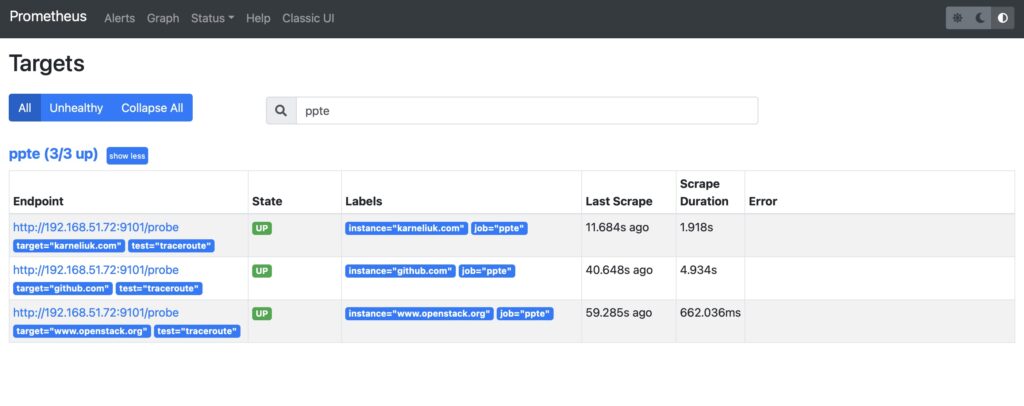
Step #1. New Prometheus Targets
Once you have restarted the Prometheus and let it a few minutes to settle, in the target list you will see a new job and the status of the polled destinations:

Step #2. Traceroute Hops Resuls
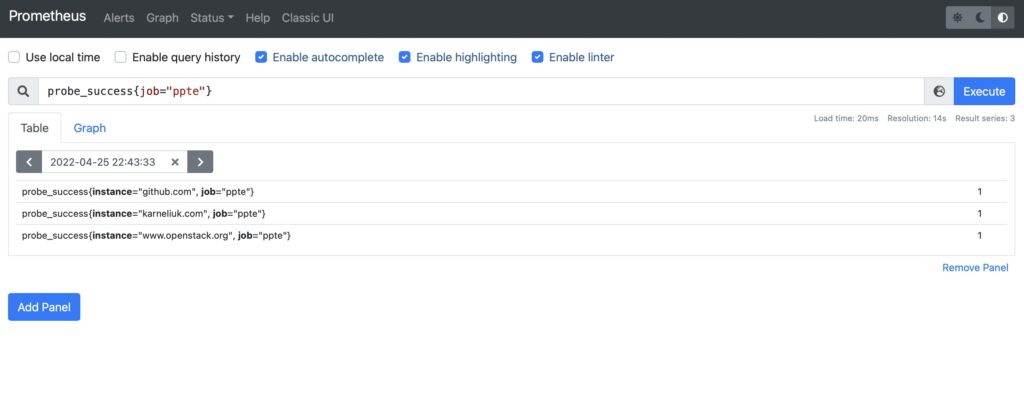
Go to “Graphs” tab and collect information about the success of probes using probe_success metric, which shows whether the traceroute measurement was successful or not:

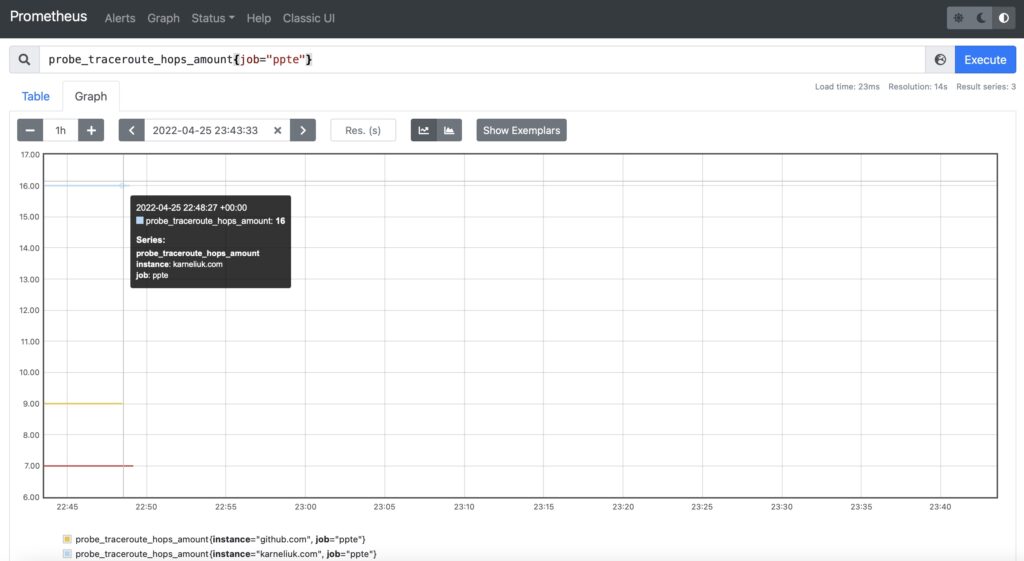
Finally, collect the probe_traceroute_hops_amount metric, which contains a value with the number of hops towards the destination from the exporter:

Examples in GitHub
You can find this and other examples in our GitHub repository.
Lessons Learned
There were there key lessons learned for us, which, on the one hand, cost us a lot of time, but, on the other hand, allowed us to advance quite a bit in the software development in general and for network automation in particular:
- For the first time we have used automated Docker image build as a part of GitHub Actions (CI/CD platform) and GitHub Container Registry (GHCR). It is not that we won’t be able to complete our project without that, as we used to use Docker Hub a lot beforehand. Moreover, it is possible to publish images in the Docker Hub from GitHub Actions as well. But, the experience itself was an interesting and useful one.
- For the first time we have build multiple Docker images for different platforms. It was quite unexpected to see that a Linux image with Alpine, which we used for a standard deployment didn’t work on Raspberry PI. Luckily, with the help of some threads in GitHub and StackExachange, we were able to figure out an issue and to build our exporter using a different base image.
- For the first time we have used WSGI, a Python built-in API gateway/web server. Compared to fastAPI, which we typically use for our projects, it was very tiny and awkward to a degree. However, its built-in nature and a simple functionality was perfect for us to achieve our goal: to be able to process API call parameters and convert them to variables, which are used to conditionally execute the script further.
Conclusion
Prometheus is rightfully one of the most popular and useful open source tools these days for metrics collection, which can be very useful in the network automation as well. For example, it is possible to create custom exporters, which will be polling the network devices or applications, which so far doesn’t have the streaming telemetry functionality neither with GNMI or NETCONF, process collected metrics and to store them in the time series database for further visualisation or processing alerting/remediation in an automated way. Take care and good bye.
Need Help? Contract Us
If you need a trusted and experienced partner to automate your network and IT infrastructure, get in touch with us.
P.S.
If you have further questions or you need help with your networks, we are happy to assist you, just send us a message. Also don’t forget to share the article on your social media, if you like it.
BR,
Anton Karneliuk