


Dear friend,
It wouldn’t be an overestimation to say that in the modern world the availability of service online plays one of the key role for success of any business: we buy, sell and use goods and services via Internet from various private and public companies as well as governmental bodies. As such, if services are not unavailable online, we, as consumers, cannot get what we need and suppliers cannot provide use the service (and, therefore, cannot make some money). That’s why the information security in general, and protection of service online becomes the hot topic these days.
Can Network Security Be Automated?
Absolutely it can be. Ensuring that configuration of network devices and online services are in-line with the security hardening blueprints is one of the most straightforward automation use cases, which provides significant value by ensuring that the amount of attack vectors is reduced and is limited to the set of services, which are really needed. Besides that, we have the whole range of vulnerability scanning, software upgrade, etc.
And for all these, and other network security automation activities, we are using the same set of tools as for “ordinary network automation”. Therefore, come and learn with us:
We offer the following training programs for you:
- Zero-to-Hero Network Automation Training
- High-scale automation with Nornir
- Ansible Automation Orchestration with Ansble Tower / AWX
- Expert-level training: Closed-loop Automation and Next-generation Monitoring
During these trainings you will learn the following topics:
- Success and failure strategies to build the automation tools.
- Principles of software developments and the most useful and convenient tools.
- Data encoding (free-text, XML, JSON, YAML, Protobuf).
- Model-driven network automation with YANG, NETCONF, RESTCONF, GNMI.
- Full configuration templating with Jinja2 based on the source of truth (NetBox).
- Best programming languages (Python, Bash) for developing automation
- The most rock-solid and functional tools for configuration management (Ansible) and Python-based automation frameworks (Nornir).
- Network automation infrastructure (Linux, Linux networking, KVM, Docker).
- Orchestration of automation workflows with AWX and its integration with NetBox, GitHub, as well as custom execution environments for better scalability.
- Collection network data via SNMP and streaming telemetry with Prometheus
- Building API gateways with Python leveraging Fast API
- Integration of alerting with Slack and your own APIs
- … and many more
Moreover, we put all mentions technologies in the context of real use cases, which our team has solved and are solving in various projects in the service providers, enterprise and data center networks and systems across the Europe and USA. That gives you opportunity to ask questions to understand the solutions in-depths and have discussions about your own projects. And on top of that, each technology is provided with online demos and labs to master your skills thoroughly. Such a mixture creates a unique learning environment, which all students value so much. Join us and unleash your potential.
Brief Description
Attacks in the Internet is not something new; in fact, they exist as long as Internet exists itself. There are multiple types of attack with different goals: starting from bringing target infrastructure down (denial of service – DoS attacks) to obtaining unauthorized access to steal some information or infect the target infrastructure and use it as a bot network for further attacks or use it as big Bitcoin mining pool. Depending on the attack’s goal, the corresponding tools for attack as well as measures for protection are chosen.
Today we start discussion how to build protection from DoS attacks, or to be precise, its more enhanced variation called DDoS (Distributed DoS) attack. So the purpose of the attack is to make the victim host such as any web service, which is typically represented as IP address(es) or FQDN(s) unavailable over the Internet. We will put aside reasons why the one may be interested in doing such an attack, and focus on the mechanics of the attack. There are two main streams for DoS attacks:
- Exploiting vulnerabilities in the operating system or application at the victim’s host(s) and making the service unavailable. Examples here would be the remote reboot or shut down of the hosts, deleting configuration of applications, etc. This is more sophisticated type of DoS attack and requires a lot of forensic work to find such vulnerabilities (unless there is some day 0 vulnerabilities are posted online and there is a window of possibilities before all the companies around the world will patch it).
- Exhausting the connectivity resources towards (or at) the victim’s host with malicious traffic, so that no legitimate traffic comes to it and, as a result, there are no real customers served.
The second type is what we are to focus today on, as this is more network related than operating system/application specific.
We intentionally simplify the further description, as there is huge variation to the setup below could be including CDNs (Content Distribution Networks).
In many cases the web services are run on the servers connected to network at 1G or 10G speed.
In some cases, this capacity could be higher, such as 25G or even 100G, but having spend more than 3 years working for big international hosting company, I could say that such servers’ connections are not yet much popular in the world of web services outside of Tier-1 cloud companies.
As such, an attacker need to be able to produce 1G or 10G of traffic to fully utilize the bandwidth available for the web service. Despite it may look like a lot of traffic, many residential ISP provide possibility to connect even home users with 1G bandwidth these days. However, DoS attacks in many legislation are considered to be a crime; therefore, typically attackers don’t run attacks from their homes. Instead, they use various techniques to use “outsourced” hosts, such as infected hosts across with the specified trojans which can trigger generation of attack traffic on demand. The math here is very simple: if an attacker has ten thousands hosts across the world, which he/she can use to generate attack traffic, even at modest 10 Mbps speed, the volume of attack on a specific host will be 100 Gbps, which more then enough to bring down not only the target, but in many cases all the other hosts connected to the same leaf (top of rack) switch and, in certain cases, even the entire data center, if this attacks bandwidth is enough to saturate the uplink from hosting’s data center to the ISP. The following figure summarizes the mechanics description:

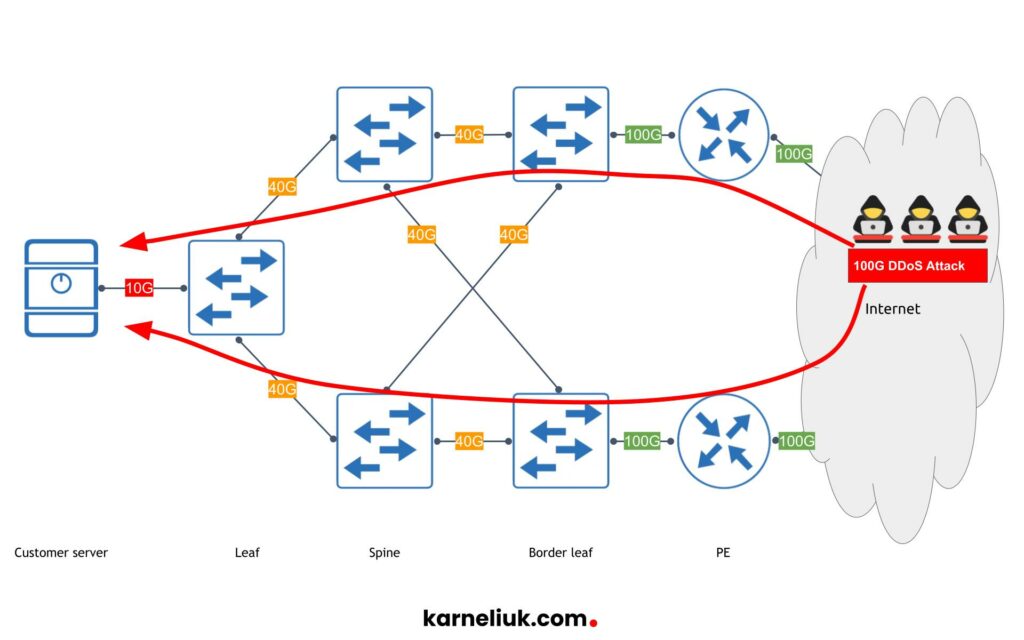
By the way, such DoS attack, conducted from multiple hosts is called DDoS, due to the distributed nature of the attack’s source. As DDoS attack is based on the network traffic, the DDoS detection tools are based on the analysis of the incoming traffic to detect certain patterns. There are a few avenues for analysis of the user’s traffic, but we will highlight the two:
- What is the traffic? Analyzing of incoming traffic to the web service allows to detect the changes in the incoming traffic (e.g., the distribution of source IP addresses is significantly changes without any customer’s activity, the higher amount of traffic to known ports (NTP amplification attack, TCP saturation, etc)).
- How is the traffic changes with the time? Analyzing the changes in the traffic volumes across the period of time (e.g., sharp increase of ingress traffic — from 500 Mbps to 5000 Mbps in 10 seconds — without any activity on customer’s side).
Analysis of the customer’s ingress traffic from the perspective of these two categories alongside with knowing what is the baseline for normal operation allows to make a judgement, if the customer’s infrastructure starts experience attack and trigger a protection.
The DDoS protection part will be covered in a separate blog.
Typically the analysis is conducted by the specific software off-line from the traffic path, as traditional network routers and switches are not capable to such an analysis themselves. However, they are capable to send the traffic for analysis using one of the following protocols (or combination of them):
- NetFlow / IPFIX
- Sflow
- SPAN/ER-SPAN
The choice of protocol is typically done based on the hardware platform capabilities and capabilities of the detection software. So, in this blogpost we will focus on two building the DDoS detection solution with:
- IPFIX (NetFlow version 10) as a protocol to sample the user traffic and creates a table of flow, which contains the 5-tuples of networking (source/destination IP addresses, IP Protocol, source/destination ports for TCP/UDP) and a lot of other important traffic-related (TCP flags, amount of packets /bytes received in this flow) as well as network-related (origin BGP ASN, source BGP ASN, ingress BGP ASN, packet TTL, etc) information. IPFIX is covered by a range of RFCs, thus, it is implemented across a variety of network vendors including Cisco IOS / IOS-XR, Juniper Jun-OS, Nokia SR OS, Arista EOS, etc.
- Nokia SR 7750 SR-1 platform running Nokia SR OS 21.10.R1, which is connected to Internet and is serving the connectivity of medium size data centre to the Internet.
- FastNetMon as an analysis and detection software. FastNetMon is one of the most popular tools for the DDoS detection world wide due to its performance and the pricing model (it has both community (free) and commercial offerings). Their community version has quite an impressive number of starts on GitHub – more than 3,1 thousands.
Let’s dive into setup.
Lab Setup
For this lab, we have the following setup:
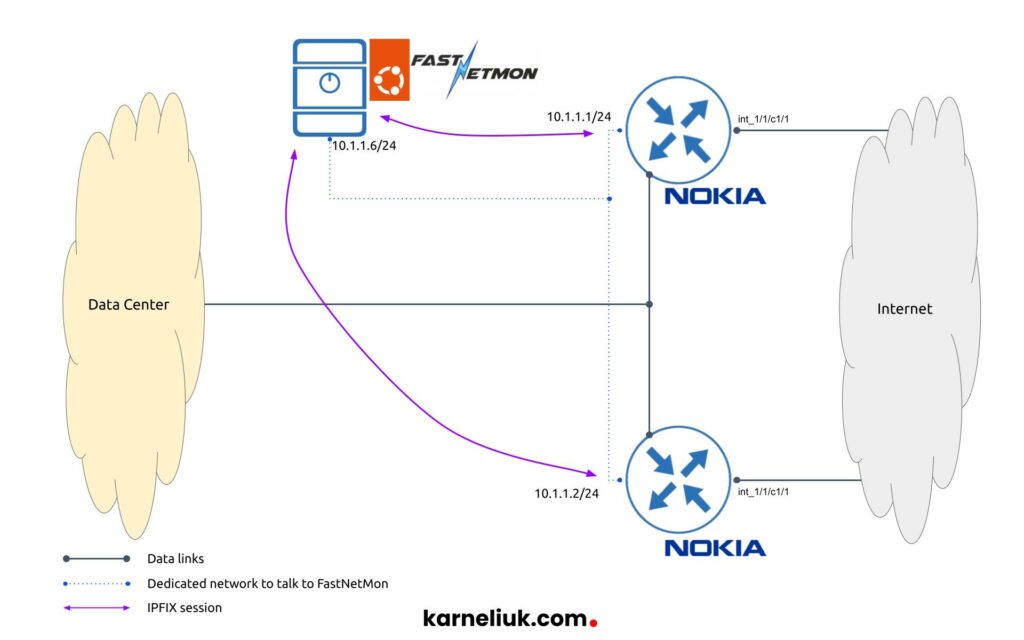
We have 2 main components, as describe before:
- Nokia 7750 SR-1 routers running Nokia SR OS 21.10.R1 software. From these routers we configure IPFIX (NetFlow or, how Nokia called it, cflow version 10).
- FastNetMon software installed as Linux packages on top of Ubuntu Linux 20.04 LTS, which will be receiving the customer traffic (flows) via IPFIX.
In this case, there is a dedicated network created to communicate between Nokia routers and FastNetMon to segregate this traffic from other systems; however, other designs are possible as well, where routers communicate to FastNetMon using in-band management relying the same network path as user traffic.
Solution Implementation
As there are two components involved in the build of DDoS detection system, which are network devices themselves and FastNetMon, we split the setup in 2 steps as well. Generally speaking, there is not much difference in which order you perform them. We prefer first to start with the Nokia SR OS part.
Step 1. Enabling IPFIX (NetFlow Version 10) on Nokia SR OS Routers
Configuration of IPFIX in Nokia SR OS, as well as other flow export mechanisms, is located in the context called cflowd. Let’s briefly take a history lesson why is that so.
Back in the days, when Cisco has delivered NetFlow version 5, which was a proprietary mechanism at that time. Other vendors developed their own tools, which were doing the same job: Nokia (that time known as Alcatel-Lucent) developed cflow and Juniper developed jflow. All these first iterfation of flow export tools were not interoperable. Luckily, further development became more standardized and Cisco published informational RFC 3954 covering its NetFlow Version 9 implementation, what allowed other vendors to make their sampling and flow export protocols interoperable with NetFlow, what means that cflowd version 9 is perfectly understandable by NetFlow version 9 collector and vice versa. The newest generation of the flow exporting is IPFIX, described in RFC 5153, which is often referred as NetFlow/cflow version 10 due to its configuration in network devices.
Now we know, where to look for the configuration of IPFIX, so let’s start with it.
Configuration of Cflow including Sample Profile
2
3
4
5
6
7
8
9
10
11
12
A:admin@nokia-sr-01#
cflowd {
admin-state enable
template-retransmit 60
use-vrtr-if-index true
active-flow-timeout 60
inactive-flow-timeout 60
sample-profile 1 {
sample-rate 1000
}
}
Within the context we have specified timers used during the export of flows towards the flow collector as well as the sampling profile. These timers depend on many parameters:
- How much traffic do you have passing through your network device?
- How powerful is your platform?
- What is your use case (i.e., how quickly is that acceptable to detect an attack)?
It is always a difficult balance you need to strike: on the one hand, the more aggressive (i.e., lower) the timers are, the quicker you will detect the attack and the more granular data about your flows you will have. On the other hand, if you are trying to export too much traffic, your device may be simply not capable to export all the flows and you will be having inaccurate statistics. 60 seconds and 1000 sampling rate (i.e, 1 out of 1000 packets are used to create a flow entry) is a good starting point for the detection to establish the baseline. Once you ensure it works accurately, you can start reducing those numbers if that is needed for your use case.
Configuration of Cflow Collector
2
3
4
5
6
7
8
9
10
11
A:admin@nokia-sr-01#
cflowd {
collector 10.1.1.6 port 2055 {
admin-state enable
description "FastNetmon"
router-instance "Base"
template-set basic
version 10
}
}
In this snippet we configure the connection to FastNetMon instance. As you see, we are using “version 10” configuration entry, which suggests that we are using IPFIX. Few other bits of configuration instructs Nokia SR router to send the flows towards collector on IP 10.1.1.6 using port 2055 (beware for firewall purpose, it is UDP, not TCP). You also need to specify what is the “template-set” you are using to export traffic, which ultimately defines which fields we do include in exported flows. In our case we use “basic“.
Configuration of interfaces where sampling is applied
2
3
4
5
6
7
8
9
10
11
12
13
14
15
16
17
18
19
20
21
22
23
24
25
A:admin@nokia-sr-01#
service {
ies "int_1/1/c1/1" {
admin-state enable
service-id 205
interface "int_1/1/c1/1" {
cflowd-parameters {
sampling unicast {
type interface
direction both
sample-profile 1
}
}
sap "1/1/c1/1" {
}
ipv4 {
primary {
address 192.168.0.2
prefix-length 30
}
}
}
}
}
Finally, we enable cflow sampling on the interfaces, we are interested in. From DDoS detection perspective, this is typically interface (or sub-interface or IES) towards IP transit providers; however, it is also to deploy netflow/cflow/ipfix monitoring on the internal links, such as DCI, to better understand, what is going in your network. By the way, FastNetMon can help with analysis of such information as well. So on the interface we specify flows in which direction we are collecting (can be ingress, egress or both), which sampling-profile we use and how flows are being collected (type interface for all flows passing through interface; alternatively you can specify ACL to match only specific flows).
By this time, configuration of Nokia SR OS for the purpose of exporting customer flows via IPFIX is ready and we move on to FastNetMon.
Step 2. Setting up FNM
FastNetMon has quite good documentation describing its setup process. There are a few distinct steps we need to follow.
Obtain the Trial License
It is totally possible to use the community version and, in fact, many companies decides to use so. However, in our case the setup was done using the trial license of the FastNetMon advanced.
Find a comparison between the two FastNetMon editions.
You can request the trial license and it will automatically be dispatched at your mail:


Once you fill in the form and request the license, you shall receive you unique trial key almost immediately.
FastNetMon Installation
Installation of FastNetMon is relatively smooth, as it supports nowadays the vast majority of modern Linux distributions: Ubuntu, Debian, Red Hat, CentOS, and Rocky. Following the official guide, perform these steps:
2
3
sudo chmod +x installer
sudo ./installer
These steps will download the installer from FastNetMon website, detect your operating system family and version and perform the corresponding installation. Once completed, you shall be able to see that it is up and running:
2
3
4
5
6
7
8
9
10
11
12
13
14
● fastnetmon.service - FastNetMon - DoS/DDoS analyzer with sFlow/Netflow/mirror support
Loaded: loaded (/lib/systemd/system/fastnetmon.service; enabled; vendor preset: enabled)
Active: active (running) since Sun 2023-02-05 21:49:37 UTC; 1 weeks 0 days ago
Main PID: 139098 (fastnetmon)
Tasks: 23 (limit: 9506)
Memory: 53.9M
CGroup: /system.slice/fastnetmon.service
└─139098 /opt/fastnetmon/app/bin/fastnetmon --daemonize
Feb 05 21:49:37 FastNetmon systemd[1]: Starting FastNetMon - DoS/DDoS analyzer with sFlow/Netflow/mirror support...
Feb 05 21:49:37 FastNetmon fastnetmon[139092]: We will run in daemonized mode
Feb 05 21:49:37 FastNetmon systemd[1]: fastnetmon.service: Can't open PID file /run/fastnetmon.pid (yet?) after start: Operation not permitted
Feb 05 21:49:37 FastNetmon systemd[1]: Started FastNetMon - DoS/DDoS analyzer with sFlow/Netflow/mirror support.
Check that your license is properly installed using the fcli (FastNetMon CLI) tool delivered together with the daemon itself:
2
Trial license for 10000 mbits valid until 2023-03-08
If you license is not active, your NetFlow/IPFIX collector won’t be active, though the only place where you will be able to see that is logs (see later).
Configuring IPFIX Collector
The next step is actually to enable receiving of NetFlow/IPFIX data. From the FastNetMon side, there is no difference what you are sending as configuration is the same for NetFlow v5/v9 an IPFIX:
2
3
4
5
6
sudo fcli set main netflow_ports 2055
sudo fcli set main netflow_host 0.0.0.0
sudo fcli set main netflow_count_packets_per_device true
sudo fcli set main average_calculation_time 60
sudo fcli commit
You can get inside interactive CLI via typing “sudo fcli”. This mode is more suitable for beginner as you can get some contextual help from the CLI itself.
As you can see from the snippet above, we enable NetFlow (including IPFIX) on port 2055 on all the interfaces. We also want to see the per network device statistic in order to understand if the communication happens. Once the desired configuration is provided, you need to type “sudo fcli commit“, which will apply the configuration to the working instance of FastNetMon. This works the same as “commit” command in the model-driven CLI in Nokia SR OS, Cisco IOS XR and Juniper JUNOS.
To ensure that FastNetMon is listening for NetFlow info, check that 2055/UDP is being listened at your host:
2
3
4
5
State Recv-Q Send-Q Local Address:Port Peer Address:Port Process
UNCONN 0 0 127.0.0.1:8100 0.0.0.0:*
UNCONN 0 0 127.0.0.53%lo:53 0.0.0.0:*
UNCONN 0 0 10.1.1.6:2055 0.0.0.0:*
If you hasn’t activated the license above, you won’t see the port being listened
Specify Networks To Monitor
Once the data collection is set, you need to specify which is your protected network (in other words, traffic to which IP addresses or from which IP addresses you want to analyze). For our test setup, we will provide some bogon network, which are not routable over the Internet:
2
3
sudo fcli set main networks_list 192.168.5.0/24
sudo fcli commit
You shall specify here all your public subnets, you want to protect from DDoS attacks. In case of huge amount of subnets you want to protect, you can use some mix of BGP between FastNetMon and your PE routers and shell scripting; however, so far we haven’t tested that ourselves, so we cannot comment on how convenient or cumbersome this approach is.
Visualization Stack
By this time you already have working FastNetMon DDoS detection system. At the same time, as we stated in the title of our blogpost, we are looking after analyzing our customer traffic and for us, humans, visualization is an important component to perform the analysis. One of the good things of FastNetMon (AFAIK, the Advanced version of FastNetMon), is that it has pre-built monitoring stack. To install it, apply the following commands:
2
3
sudo chmod +x installer
sudo ./installer -install_graphic_stack
Despite the installation looks similar to the FastNetMon itself, it requires the working FastNetMon first. So, don’t worry that it can spoil the existing configuration you have done: it will not.
During the installation, you will see a bit of logs. The most important are at the end, which provides your details on which port and with which account you need to login to see the stats:
2
14:00:52 Please login into http://your.ip.addr.ess:81 or https://your.ip.addr.ess with login admin and password ***
Open your browser the Grafana (at Ubuntu Linux, we use https://10.0.0.6 for our lab) and you shall be asked to provide credentails by NGINX, which is deployed automatically as a reverse proxy before Grafana. Once credentials are provided, you will see the starting screen of Grafana:

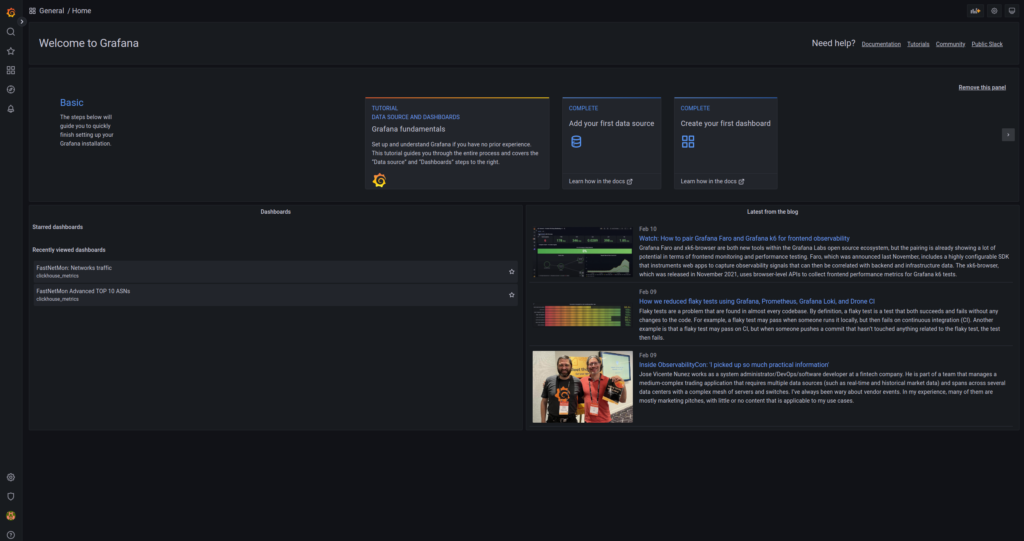
The FastNetMon setup is completed as well and it is a time to do validation.
Validation
Once the setup is completed, we shall be able to see that everything is working properly.
Nokia SR OS side Validation
From Nokia SR OS side, first of all, check the overall cflow summary:
2
3
4
5
6
7
8
9
10
11
12
13
14
15
16
17
18
19
20
21
22
23
24
25
26
27
28
29
30
31
32
33
34
35
36
37
38
39
40
41
42
43
44
45
46
===============================================================================
Cflowd Status
===============================================================================
Cflowd Admin Status : Enabled
Cflowd Oper Status : Enabled
Cflowd Export Mode : Automatic
Active Flow Timeout : 60 seconds
Inactive Flow Timeout: 60 seconds
Template Retransmit : 60 seconds
Cache Size : 65536 entries
Overflow : 1%
Aggregation Summary : (Not Specified)
VRtr If Index Context: vrtr
Analyze GRE : Disabled
Analyze L2TP : Disabled
Analyze IPV4overV6 : Disabled
Active Flows : 1909
Dropped Flows : 2193
Total Pkts Rcvd : 54760264
Total Pkts Dropped : 0
Overflow Events : 0
Raw Flow Counts Aggregate Flow Counts
Flows Created 36253803 0
Flows Matched 18506461 0
Flows Flushed 36249701 0
===============================================================================
Sample Profile Info
===============================================================================
Profile Id Sample Rate
-------------------------------------------------------------------------------
1 1000
===============================================================================
Version Info
===============================================================================
Version Status Sent Open Errors
-------------------------------------------------------------------------------
5 Disabled 0 0 0
8 Disabled 0 0 0
9 Disabled 0 0 0
10 Enabled 1765042 1 0
===============================================================================
The summary screen should show that you are successfully exporting IPFIX (version 10) flows: the success criteria is defined by the value of Open set to 1 as well as non-zero value in Sent field. You can also review the active timeouts and other general parameters including the administrative and operational state of cflow process in general
Then, check that the collector is working as it is expected:
2
3
4
5
6
7
8
9
10
11
12
===============================================================================
Cflowd Collectors
Legend: P - Packets, R - Records
===============================================================================
Host Address Port Ver AS Type Admin Oper Sent
-------------------------------------------------------------------------------
10.1.1.6 2055 v10 - up up 21107775 R
-------------------------------------------------------------------------------
Collectors : 1
===============================================================================
Here everything is straightforward: you shall see that your collector defined by IP address, port and NetFlow/IPFIX version is up/up.
Finally, check that all the interfaces you would expect to see with the sampling and flows collection enabled are acting so:
2
3
4
5
6
7
8
9
10
11
12
13
14
15
16
===============================================================================
Cflowd Interfaces
===============================================================================
Interface Router IF Index Type/Dir Admin
IPv4Address Samp Oper IPv4
IPv6Address Oper IPv6
-------------------------------------------------------------------------------
int_1/1/c1/1 Base 5 intf/both Up
192.168.0.2/30 uni Up
------------------------------------------------------------------------
Interfaces : 1
===============================================================================
[/]
At this screen you shall see which interfaces you have NetFlow sampling enabled on, as well as type and direction of sampling.
FastNetMon side Validation
On top of what we have discussed before, there is a few other checks you may want to do in fcli to ensure that your DDoS detection (to be preciese, IPFIX collector for the time being) is working:
2
3
4
5
6
7
8
9
10
11
12
13
14
15
16
17
18
19
20
21
10.1.1.1 1321871
10.1.1.2 1857661
$ sudo fcli show total_traffic_counters
incoming traffic 67466 pps
incoming traffic 177 mbps
incoming traffic 0 flows
outgoing traffic 3333 pps
outgoing traffic 33 mbps
outgoing traffic 0 flows
internal traffic 0 pps
internal traffic 0 mbps
other traffic 0 pps
other traffic 0 mbps
$ sudo fcli show network_counters
192.168.0.0/23 in packets: 6416 out packets: 16 in mbps: 61 out mbps: 0
192.168.5.0/24 in packets: 10633 out packets: 50 in mbps: 29 out mbps: 0
These three commands in order of their applications allows you see:
- How many packets are received from each Nokia SR 7750 router
- What is the overall ingress/egress traffic based on the IPFIX flows
- What is the traffic per subnet based on the IPFIX flows
At this stage it is worth to cross check traffic levels with your other monitoring systems, which are based on SNMP/Streaming telemetry. If these numbers are miles apart, you should try to change configuration of NetFlow exporter and/or BW calculation timers on FastNetMon
We can finally go to the Grafana UI, which has been deployed together with FastNetMon. Log to the IP address of the server on https port per the output of the visualisation stack. You will se the variety of pre-build graphs:

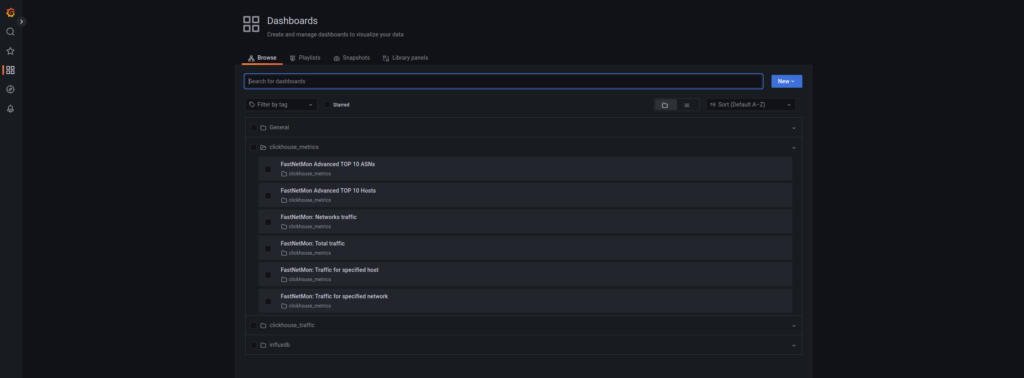
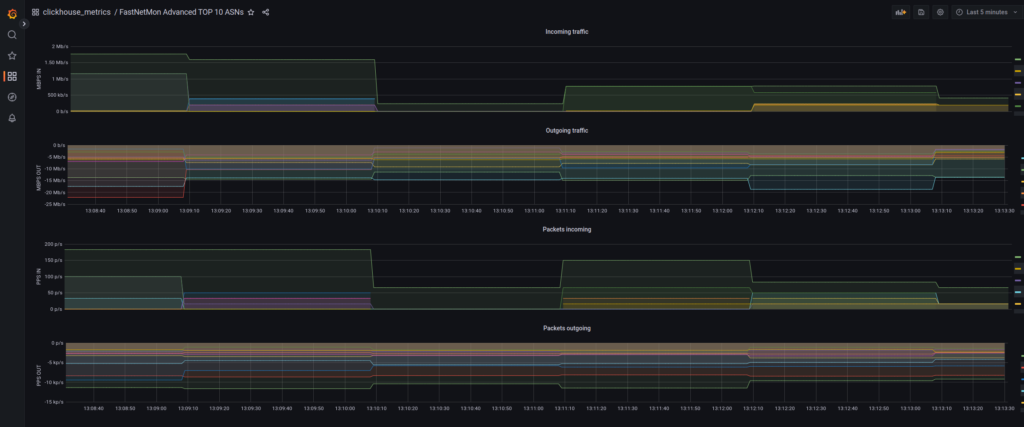
For example, you are interested in top 10 ASN talkers. Choose the corresponding URL and hit it:

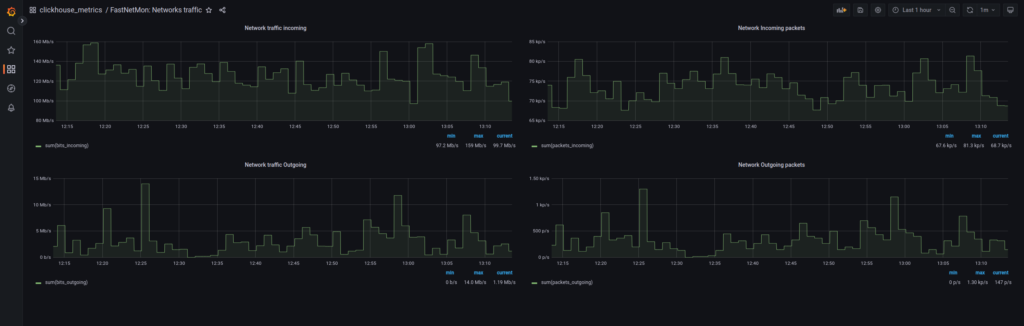
Or you may be interested in overall ingress/egress traffic levels of your network:

Besides the variety of pre-build dashboards, you can create your own depending on your needs.
Lessons Learned
We spent quite a bit of time tuning this system to work properly. Originally, we set too aggressive timers in terms of exporting info from Nokia Routers and, unfortunately, we missed quite a bit of traffic for our BW calculation. Luckily, a good friend of mine advised what the timeouts in Nokia shall be. Setting the NetFlow properly is real art.
Summary
Knowing what is going in your network is a first step in implementing the DDoS protection. Without establishing baseline, it is impossible to set any DDoS detection as you won’t be able to detect, when the protection is to be triggered. FastNetMon allows you to see what is going in your network and to enable start collecting important stats. In a separate post we will discuss how to set the detection threshold and to trigger the protection. Take care and good bye!
Need Help? Contract Us
If you need a trusted and experienced partner to automate your network and IT infrastructure, get in touch with us.
P.S.
If you have further questions or you need help with your networks, we are happy to assist you, just send us a message. Also don’t forget to share the article on your social media, if you like it.
BR,
Anton Karneliuk