

Hello my friend,
Within the Service Provider Project some time ago we’ve reviewed on of the most popular and robust stack for monitoring virtually anything based on InfluxData Telegraf, InfluxDB and Grafana. That time we’ve used SNMP to collect the information from the network functions provided by four different vendors. Today we focus on another “old-timer” protocol used in network and application management. It’s time for logs… Syslog!
2
3
4
5
retrieval system, or transmitted in any form or by any
means, electronic, mechanical or photocopying, recording,
or otherwise, for commercial purposes without the
prior permission of the author.
Disclaimer
The name of the article could be misleading. Well, true, but there is a reason for that. I’ve initially tried to deploy the log collection via syslog for the Service Provider Fabric, but it doesn’t work due to network elements SW (more details on this topic come later). Then I’ve tried to perform that for the Data Centre Fabric and that partially flied, though the same restrictions have been applicable as with the Service Provider Fabric. As the monitoring and automation is integrated in both projects now, I’ve decided to name the article “DC/SP” showing the real applicability as well as the job done by integration.
Brief description
Everybody uses logs. That’s just an axiom, as it’s impossible to imagine any operational activity, especially troubleshooting, without using logs. It’s quite often the first thing you configure on the network function, long before you configure interfaces. I mean the logging and their details in general, because the syslog is configured, when you have at least out of band management connectivity.
Obviously, the applicability of the logs are much wider than a network functions. When I was developing the ZTP (zero-touch provisioning) stack the last time, I used logs from the Docker containers a lot for troubleshooting of the ZTP process. Therefore, logs are everywhere.
In the same article about ZTP, we have pointed out that the initial zero-touch provision process is the just the first step in the full automated network. The next step would be the solution, which automatically deploys the proper configuration on the network element, when it’s deployed. The easiest way is to pre-generate the configuration file and upload them to the network element using ZTP process. However, the easiest way is not necessary the most scalable and convenient. Due to this fact, we continue the development of the proper solution, what will be more scalable and reliable. We won’t finalize it today, but we will pass half a way to the goal by implementing the centralized collection and processing of the Syslog data.
We’ve mentioned in the disclaimer, that there were some problems with the network elements syslog collection. During writing this article I’ve have learned that there are different standards of the Syslog. All the network operation systems I have tested (Arista EOS, Cisco IOS XR, Cumulus Linux, Nokia SR OS) use so-called “the BSD syslog protocol” based on RFC 3164. On the other hand, the Telegraf plugin for syslog uses newer format called “the syslog protocol” described in RFC 5424. These two formats aren’t interoperable, and that was the reason why I failed with syslog integration in the Service Provider Fabric. On the time of writing there is no option to change the syslog format for Nokia SR OS, Cisco IOS XR or Arista EOS (at least, I haven’t found). For the Cumulus Linux the things are different, as it is Debian Linux on steroids, and in the Linux it’s possible to change the syslog format within the rsyslog daemon, so I have managed to connect Cumulus VX to the Telegraf syslog collector. For the Docker containers it was fairly easy as they natively supports RFC 5424 for the syslog. Frankly speaking, the latter is even more important for me as the logs from the Docker containers are the basis for the full-blown data centre automation, what will be covered in the next article.
What are we going to test?
The plan for the lab is the following:
- Extend the TIG monitoring with an additional Docker container with Telegraf to collect syslog.
- Configure all Docker containers to send the logs over syslog to Telegraf in RFC 5424 format.
- Configure Cumulus Linux switches to send the logs over syslog to Telegraf in RFC 5424 format.
- Visualize the logs with Grafana
The success criteria for the lab is that we can see the syslog information from our enabler stack (DHCP, DNS, HTTP and FTP as well as Telegraf, Grafana and InfluxDB) and Cumulus fabric in Grafana.
Software version
The following software components are used in this lab.
Management host:
- CentOS 7.5.1804 with python 2.7.5
- Ansible 2.8.0
- Docker-CE 18.09
- Containerized NetBox
Enabler and monitoring infrastructure:
- Base Linux image for container: Alpine Linux 3.9
- DHCP: ISC DHCP 4.4.1-r2
- DNS: ISC BIND 9.12.3_p4-r2
- FTP: VSFTPD 3.0.3-r6
- HTTP: NGINX 1.14.2-r1
- InfluxData Telegraf: 1.10.3
- InfluxData TSDB: 1.7.6
- Grafana: 6.1.6
The Data Centre Fabric:
- Nokia SR OS 16.0.R7 [guest VNF]
- Arista EOS 4.21.1.1F [guest VNF]
- Cisco IOS XR 6.5.1 [guest VNF]
- Cumulus Linux 3.7.5 [guest VNF]
More details about Data Centre Fabric you may find in the previous articles.
Topology
This is the management topology from the previous lab extended with four new containers:
2
3
4
5
6
7
8
9
10
11
12
13
14
15
16
17
18
19
20
21
22
23
24
25
26
27
28
29
30
31
| /\/\/\/\/\/\/\/\/\/\/\/\/\/\/\/\ |
| +-----------------+ +-----------------+ / +------+ +------+ Docker cloud \ |
| | de+bln+spine+101| (c)karneliuk.com // Data Centre Fabric | de+bln+spine+201| / |TELEG1| |TELEG2| +------+ \ |
| | (Cisco IOS XRv) | | (Nokia VSR) | \ +------+ +------+ +---+ DHCP | / |
| | Lo0: .1 | | system: .2 | / |.8 |.9 | .2+------+ \ |
| | BGP AS: 65000 | | BGP AS: 65000 | \ +-------------+ / |
| +-------+---------+ IP^4: 192.168.1.0/24 +--------+--------+ \ | +------+ \ |
| | IPv6: fc00:de:1:ffff::/64 | \+------------+ +---+ DNS | / |
| | MgmtEth0/CPU0/0 | MgmtEth0/CPU0/0| Management +----+ .3+------+ \ |
| | .25/:25 | .26/:26 | host |.1 | / |
| | | +------+-----+ | +------+ \ |
| | | | \ +---+ FTP | / |
| | | | ens33\ | .4+------+ \ |
| +-------------------+--------------+---------------------------------+-------------+-------------------+---+ .137 \ | / |
| | | | | :137 / | +------+ \ |
| | | | | \ +---+ HTTP | / |
| | | | | \ | .5+------+ \ |
| | eth0 | eth0 | Management1 | Management1/ | / |
| | .21/:21 | .22/:22 | .23/:23 | .24/:24 \ | +------+ \ |
| | | | | / +---+INFLUX| / |
| +------------------+ +---------+--------+ +---------+--------+ +---------+--------+ \ | .6+------+ \ |
| | de+bln+leaf+111 | | de+bln+leaf+112 | | de+bln+leaf+211 | | de+bln+leaf+212 | / | / |
| | (Cumulus VX) | | (Cumulus VX) | | (Arista vEOS) | | (Arista vEOS) | \ | +------+ \ |
| | lo: .101 | | lo: .102 | | Lo0: .104 | | Lo0: .105 | \+---+GRAFAN| / |
| | BGP AS: 65101 | | BGP AS: 65102 | | BGP AS: 65104 | | BGP AS: 65105 | / .7+------+ \ |
| +------------------+ +------------------+ +------------------+ +------------------+ \ 172.17.0.0/16/ |
| \ / |
| \/\/\/\/\/\/ |
| |
+--------------------------------------------------------------------------------------------------------------------------------------------------+
You can use any hypervisor of your choice (KVM, VMWare Player/ESXI, etc) to run guest VNFs. For KVM you can use corresponding cheat sheet for VM creation.
The four new containers are:
- Telegraf for SNMP collection (like in the Service Provider Fabric).
- InfluxDB for metrics collection (like in the Service Provider Fabric).
- Grafana for information visualization (like in the Service Provider Fabric).
- Telegraf for syslog collection (new one).
There is one important change in the Docker network: I’ve moved all the applications to the user-defined Docker bridge network. This makes the stack protected from interaction with other applications. The name of the network and its parameters are defined in the “group_vars”, though they can be documented in the NetBox as well.
The physical topology isn’t changed since the last lab:
2
3
4
5
6
7
8
9
10
11
12
13
14
15
16
17
18
19
20
21
22
23
24
25
26
27
28
29
30
31
| |
| +-----------------+ +-----------------+ |
| | de-bln-spine-101| (c)karneliuk.com // Data Centre Fabric | de-bln-spine-201| |
| | (Cisco IOS XRv) | | (Nokia VSR) | |
| | Lo0: .1 | | system: .2 | |
| | BGP AS: 65000 | IPv4 links: 169.254.0.0/24 eq 31 | BGP AS: 65000 | |
| +--+---+---+---+--+ IPv6 loopb: 10.1.1.0/24 eq 32 +--+---+---+---+--+ |
| |.0 |.4 |.8 |.12 IPv6 links: fc00:de:1:0::/64 eq 127 |.2 |.6 |.10|.14 |
| +-----------------+:0 |:4 |:8 |:c IPv6 loopb: fc00:de:1:1::/64 eq 128 |:2 |:6 |:a |:e |
| | | | | | | | | |
| | +------------------------------------------------------------------------+ | | | |
| | | | | | | | | |
| | | +-----------+ +------------------------------------------+ | | |
| | | | | | | | | |
| | | +-----------------------------------------+ +------------+ +----------------+ |
| | | | | | | | | |
| | | +-----------------------------------------------------------------------+ | |
| | | | | | | | | |
| | swp3 | swp4 | swp3 | swp4 | Eth3 | Eth4 | Eth3 | Eth4 |
| | .1/:1| .3/:3 | .5/:5| .7/:7 | .9/:9| .11/:b |.13/:d| .15/:f |
| +-----+------+-----+ +-----+------+-----+ +-----+------+-----+ +-----+------+-----+ |
| | de-bln-leaf-111 +--------------+ de-bln-leaf-112 | | de-bln-leaf-211 +--------------+ de-bln-leaf-212 | |
| | (Cumulus VX) | swp1 swp1 | (Cumulus VX) | | (Arista vEOS) | Eth1 Eth1 | (Arista vEOS) | |
| | lo: .101 | | lo: .102 | | Lo0: .104 | | Lo0: .105 | |
| | BGP AS: 65101 +--------------+ BGP AS: 65102 | | BGP AS: 65104 +--------------+ BGP AS: 65105 | |
| +--+------------+--+ swp2 swp2 +--+------------+--+ +--+------------+--+ Eth2 Eth2 +--+------------+--+ |
| | | | | | | | | |
| + + Anycast IP: .100 + + + + Anycast IP: .103 + + |
| |
+--------------------------------------------------------------------------------------------------------------------------------+
If you need more details on the topology explanation, refer to the previous article.
Due to the reasons with the syslog version differences explained in the beginning of the article, all the switches are Cumulus Linux VXs (all four leafs and two spines). The new release of the Data Centre Fabric contains the shell scripts, which automate the deployment of the provided topology for KVM.
The topologies and initial configuration files you can find on my GitHub.
The architecture of the monitoring system
Let’s start the detailed discussion from the architecture of the monitoring system. Earlier in the Service Provider Fabric we have deployed a single InfluxDB Docker container, where we have created a single DB instance inside called “spf”. Then there were a single container with Telegraf, which collected the SNMP information and stored them in that database. Finalizing the setup there was a Docker container with Grafana, which were collecting the information from the database instance created inside the InfluxDB, to visualize the measurements. To sum up, the initial monitoring architecture was quite straightforward:
2
3
4
5
6
7
8
9
10
11
12
13
14
| |
| +-----------------+ +-----------------+ |
| | InfluxDB | | Grafana | |
| +------------+ | | | | |
| | | | +-----------+ | | +-----------+ | |
| +--------->+ Telegraf +------------->+ DB: spf +-------------->+SNMP Dashb.| +----------> |
| SNMP | | | +-----------+ | | +-----------+ | Customer |
| input +------------+ | | | | |
| +-----------------+ +-----------------+ |
| |
| |
| |
+--------------------------------------------------------------------------------------------------+
However, this time need to collect additional information, and even the type of the information (meaning the number of columns, etc) is different. It is still possible to put everything to the same database, though this is not the best idea. Therefore, we will create a separate database instance inside given InfluxDB Docker container, which will store the syslog information. Fro, the information collection prospective, we will launch a new Docker container with Telegraf configured to collect syslog data, which then will be stored in the mentioned new DB instance in InfluxDB. From Grafana perspective, we will configure new source DB, pointing to the same InfluxDB container, but to another database. If we put all these ideas together, our updated monitoring architecture will look like as follows:
2
3
4
5
6
7
8
9
10
11
12
13
14
15
16
17
18
19
20
| |
| +-----------------+ +-----------------+ |
| | InfluxDB | | Grafana | |
| +------------+ | | | | |
| | | | +-----------+ | | +-----------+ | |
| +--------->+ Telegraf1 +------------->+DB:dcf_snmp+-------------->+SNMP Dashb.| +----------> |
| SNMP | | | +-----------+ | | +-----------+ | Customer |
| input +------------+ | | | | |
| | | | | |
| +------------+ | | | | |
| | | | +-----------+ | | +-----------+ | |
| +--------->+ Telegraf2 +------------->+DB:dcf_sysl+-------------->+SYSL Dashb.| | |
| Syslog | | | +-----------+ | | +-----------+ | |
| input +------------+ | | | | |
| | | | | |
| +-----------------+ +-----------------+ |
| |
| |
+--------------------------------------------------------------------------------------------------+
Running the application in the Docker containers gives us flexibility to multiply the components based on our needs, therefore we can easily start the new Telegraf container with different input/output plugins or parameters. In the future, we can also have two different InfluxDB containers, each serving its own database, if it is more beneficial from performance point of view. The Docker container world gives as much flexibility as we can accommodate.
#1. Deployment of the user-defined network in Docker
Once the architecture is clear, we can start it’s realisation. As monitoring stack is a quite closed set of application aimed to be interconnected with each other, we move it to isolated network called user-defined Docker bridge. We can move other applications there as well, but this article doesn’t cover that part.
The process of the user-defined bridge creation is straightforward, as you just need to provide a name and that’s it. By default the IPv4 subnet and default gateway will be generated using the next free subnet after the default bridge. For example, if the default bridge uses 172.17.0.0/16 subnet, the user-defined bridge will get 172.18.0.0/16 or any other free subnet.
Being IPv6 fan, I’m always enabling IPv6 for communication between network elements where possible, that’s why the Docker bridge should also have IPv6 (as it was explained later, it collects SNMP over Ipv6 in my setup (link)). All in all, the Docker bridge in this lab setup looks like as follows:
The “mon_net” is a name of the Docker network, the flag “–ipv6” indicates that the bridge should have IPv6 addresses, where the “–subnet” and “–gateway” provides corresponding IPv6 addresses.
Once the Docker bridge is created, we can verify its status:
2
3
4
5
6
7
8
9
10
11
12
13
14
15
16
17
18
19
20
21
22
23
24
25
26
27
28
29
30
31
32
33
34
35
[
{
"Name": "mon_net",
"Id": "76b93aff7400426dd044f3f3af6883159e4f82195d786c89d7b66afbe924635d",
"Created": "2019-05-11T18:31:41.810624055+02:00",
"Scope": "local",
"Driver": "bridge",
"EnableIPv6": true,
"IPAM": {
"Driver": "default",
"Options": {},
"Config": [
{
"Subnet": "172.20.0.0/16",
"Gateway": "172.20.0.1"
},
{
"Subnet": "fc00:de:1:fffe::/64",
"Gateway": "fc00:de:1:fffe::1"
}
]
},
"Internal": false,
"Attachable": false,
"Ingress": false,
"ConfigFrom": {
"Network": ""
},
"ConfigOnly": false,
"Containers": {},
"Options": {},
"Labels": {}
}
]
As said earlier, this information can be documented in the NetBox (and possibly it would be the best option). But I haven’t done that yet so far in terms of automation and just put this info in the Ansible variables having documented only the range in NetBox:
2
3
4
5
6
7
8
9
10
11
12
13
14
---
! THE OUTPUT IS OMITTED
# Defaults for Docker containers
docker:
path_to_containers: containers
repo: akarneliuk
private_network:
name: mon_net
ipv6: true
subnet: fc00:de:1:fffe::/64
gateway: fc00:de:1:fffe::1
! THE OUTPUT IS OMITTED
...
Once the topic with the freshly-baked Docker user-defined user bridge is closed, we can move further.
#2. InfluxDB configuration update
The installation and configuration of the Docker container with InfluxDB was already covered in all the details in the Service Provider Fabric project.
That’s why in this part we’ll cover only necessary delta. Once the container with the InfluxDB is up and running, we need to create two databases (one for SNMP, and another for Syslog) and user credentials. We do it using the REST API to the InfluxDB app:
2
3
$ curl -X POST http://localhost:8086/query --data-urlencode "q=CREATE DATABASE dcf_syslog"
$ curl -X POST http://localhost:8086/query --data-urlencode "q=CREATE USER dcf_workforce WITH PASSWORD 'dcf_w0rkf0rc3' WITH ALL PRIVILEGES"
Refer to the original article to learn all the necessary steps about building InfluxDB with Docker.
The parameters with the names of the databases as well as the credentials are stored in the file with Ansible variables:
2
3
4
5
6
7
8
9
10
11
12
13
14
---
! THE OUTPUT IS OMITTED
# InfluxData TICK
var_influxdb:
username: dcf_workforce
password: dcf_w0rkf0rc3
db_name:
snmp: dcf_snmp
syslog: dcf_syslog
var_grafana:
var_telegraf:
! THE OUTPUT IS OMITTED
...
All the rest parts of the configuration, such as SSL certificate and access to the InfluxDB over HTTPS with proper credentials, are untouched.
#3. Telegraf and syslog input plugin configuration
The installation and configuration of the Docker container with Telegraf was already covered in all the details in the Service Provider Fabric project.
As you remember, the configuration if the Telegraf by InfluxData is fully based on the “telegraf.conf” file. By default this file lists all the available input, processing and outputs plugins in a commented way (not active). From the syslog prospective in our architecture, we would need to have only one output plugin to connect to the proper database in the InfluxDB app and one input plugin to listen for incoming Syslog messages. Let’s start with the recap of the output part, as you should be already familiar with that:
2
3
4
5
6
7
8
9
10
11
12
13
14
15
16
17
# Telegraf Configuration
###############################################################################
# OUTPUT PLUGINS #
###############################################################################
# Configuration for sending metrics to InfluxDB
[[outputs.influxdb]]
urls = ["https://172.20.0.2:8086"]
database = "dcf_syslog"
skip_database_creation = true
timeout = "5s"
username = "dcf_workforce"
password = "dcf_w0rkf0rc3"
insecure_skip_verify = true
! THE OUTPUT IS OMITTED
The following explanation reminds you the building blocks of the output plugin:
- Urls contains the IP address, the port, and the protocol how the Telegarf application can reach the InfluxDB. We provide here the IP address from the user-define Docker bridge “mon_net”.
- Database instructs the Telegraf, which database within the InfluxDB it should use.
- It’s supposed the database is initially created, therefore skip_database_creation is enabled.
- Timeout sets the waiting timer for not getting response from the InfluxDB bedofre considering the attempt failed.
- Username/password contain the credentials to access the InfluxDB.
- As we haven’t yet deployed a centralized PKI and we are using self-signed certificates, we disable certificate validation by insecure_skip_verify to use the certificate blindly. In such a way we protect the sent HTTP traffic with the encryption.
What you haven’t seen yet in my articles is the input plugin for syslog:
2
3
4
5
6
7
8
9
10
# Telegraf Configuration
! THE OUTPUT IS OMITTED
###############################################################################
# SERVICE INPUT PLUGINS #
###############################################################################
# Accepts syslog messages following RFC5424 format with transports as per RFC5426, RFC5425, or RFC6587
[[inputs.syslog]]
server = "udp://0.0.0.0:514"
The configuration of the input syslog plugin for Telegraf is relatively straightforward (like many other things in Telegraf). There may be several parameters configured, but we tweak only a single one: server. This parameter instructs the Telegraf, what is the IP address, the port and the protocol it should listen to receive the Syslog messages.
We need just to launch the Docker container using this configuration file as and we are ready to receive and store Syslog messages:
2
3
4
5
-v $PWD/telegraf.conf:/etc/telegraf/telegraf.conf:ro \
--network mon_net \
--name dcf_telegraf_syslog \
telegraf -config /etc/telegraf/telegraf.conf
#4. Grafana databases update
The installation and configuration of the Docker container with InfluxDB was already covered in all the details in the Service Provider Fabric project.
From the syslog prospective, we need to configure the Grafana application in a way it that it can collect that information, meaning we need to provide a path for a corresponding database (Configuration -> Data Sources -> Add data Source à InfluxDB):

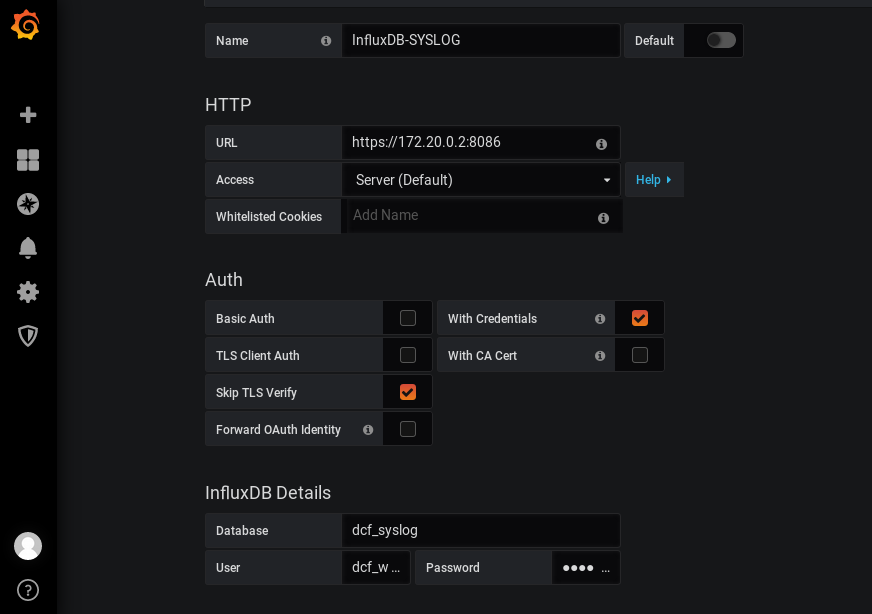
As you can see here, the IP address of the URL as well as the Database and User/Password are identical to one configured in Telegraf, meaning the appropriate data will be collected from the InfluxDB given it’s written there by Telegraf. This we will check in a couple of minutes, once we update the configuration of the Docker containers.
#5. Modification of the Docker containers from the infrastructure enabler stack to syslog driver
All the information provided above this point was about a creation of the framework to collect the syslog data. Now it’s a time to start actually collecting these logs from the Docker containers. The good thing is that the Docker has an outstanding documentation describing all the bits and bytes of its configuration including the configuration of the syslog drivers. You can read the provided link to see all the possible details, whereas here I will focus only what is relevant to our setup.
By default, you can see the logs from the Docker container using “sudo show docker logs $container_name_or_id” command as demonstrated below:
2
3
4
5
6
7
8
9
10
11
12
13
14
15
16
2019-05-23T05:13:52Z I! Starting Telegraf 1.10.3
2019-05-23T05:13:52Z I! Loaded inputs: syslog
2019-05-23T05:13:52Z I! Loaded aggregators:
2019-05-23T05:13:52Z I! Loaded processors:
2019-05-23T05:13:52Z I! Loaded outputs: influxdb
2019-05-23T05:13:52Z I! Tags enabled: host=1e6a06380753
2019-05-23T05:13:52Z I! [agent] Config: Interval:10s, Quiet:false, Hostname:"1e6a06380753", Flush Interval:10s
2019-05-23T06:45:53Z I! [agent] Hang on, flushing any cached metrics before shutdown
2019-05-23T16:47:41Z I! Starting Telegraf 1.10.3
2019-05-23T16:47:41Z I! Loaded inputs: syslog
2019-05-23T16:47:41Z I! Loaded aggregators:
2019-05-23T16:47:41Z I! Loaded processors:
2019-05-23T16:47:41Z I! Loaded outputs: influxdb
2019-05-23T16:47:41Z I! Tags enabled: host=1e6a06380753
2019-05-23T16:47:41Z I! [agent] Config: Interval:10s, Quiet:false, Hostname:"1e6a06380753", Flush Interval:10s
To send the logs to the syslog, you need to change the logging driver. You can do it either for all the containers by updating the “/etc/docker/daemon.json” file or for a specific container by passing the corresponding parameters during the container creation process. We’ll focus on the second option.
The following example covers the necessary changes for the Docker container with the DHCP service:
2
3
4
5
6
7
-v $PWD/data/dhcpd.conf:/etc/dhcp/dhcpd.conf:ro \
--log-driver syslog \
--log-opt syslog-address=udp://192.168.1.1:514 \
--log-opt tag=dcf_dhcp \
--log-opt syslog-format=rfc5424 \
--name dcf_dhcp akarneliuk/dcf_dhcp
All the relevant details about the Docker container with DHCH (as well as DNS, HTTP and FTP) you can find in a dedicated article.
Let’s take a closer look on the new entries:
- Log-driver defines how the logs will be stored or send. For this case, we use the syslog driver.
- Log-opt specifies all the detailed parameters associated with the chosen driver.
- The first such parameter is syslog-address, which contains the IP address, the port and the protocol, which the syslog server listens for.
- The parameter tag ultimately identifies, how the Docker container can be found in the syslog stream. By default it is equal to the short ID of the container (the last 10 symbols). We change it to the container name, as it is much easier to read the meaningful name in the Grafana later.
- The third parameter we configure is the syslog-format. Though the Docker by default should use RFC 5424, I typically try to avoid any default values, hence we set it to RFC 5424 format specifically.
I believe, you can follow this logic, as it’s pretty straightforward. All the containers we deployed in the Zero Touch provisioning article and in the current lab (excluding the Docker container with Telegraf collecting syslog), we configure in such a way. The reason, why I have excluded that container, is that from the troubleshooting perspective, it’s better to have is separated (or at least to log it data to another syslog server). During the initial setup I got to the situation, that I didn’t collect the logs and can’t check why, as the container with Telegraf/syslog was sending syslog to itself. It isn’t the problem, if everything works properly, though.
Once we have configured all the containers in such a way and deployed the InfluxDB and Telegraf as explained, we start collecting the logs in the InfluxDB. You can verify that the logs are there using REST API:
2
3
4
5
6
7
8
9
10
11
12
13
14
15
16
17
18
19
20
21
22
23
24
25
26
27
28
29
30
31
32
33
34
35
36
37
38
39
40
41
42
43
44
45
46
47
48
49
50
51
52
53
54
55
56
57
% Total % Received % Xferd Average Speed Time Time Time Current
Dload Upload Total Spent Left Speed
0 0 0 0 0 0 0 0 --:--:-- --:--:-- --:--:-- 0{
"results": [
{
"statement_id": 0,
"series": [
{
"name": "syslog",
"columns": [
"time",
"appname",
"facility",
"facility_code",
"host",
"hostname",
"message",
"msgid",
"procid",
"severity",
"severity_code",
"timestamp",
"version"
],
"values": [
[
"2019-05-23T05:09:42.085648678Z",
"dcf_telegraf_snmp",
"daemon",
3,
"3c9eab948ab8",
"sand9.karneliuk.com",
"2019-05-23T05:09:42Z I! Starting Telegraf 1.10.3",
"dcf_telegraf_snmp",
"11940",
"err",
3,
1558588182000000000,
1
],
[
"2019-05-23T05:09:42.08567477Z",
"dcf_telegraf_snmp",
"daemon",
3,
"3c9eab948ab8",
"sand9.karneliuk.com",
"2019-05-23T05:09:42Z I! Loaded inputs: snmp",
"dcf_telegraf_snmp",
"11940",
"err",
3,
1558588182000000000,
1
],
! THE OUTPUT IS OMITTED
As long as you can see that the logs are there, you can proceed with the most beautiful part, which is the visualization using Grafana.
#6. Building Grafana dashboards to monitor logs from Docker containers
In Grafana we create a new dashboard, which will have just two Graphs:
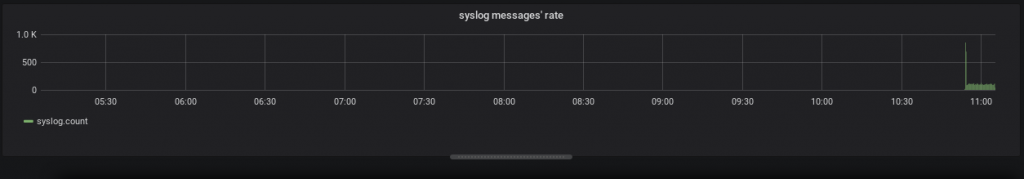
- Syslog messages’ rate will show the information, about the number of the syslog messages collected in a specific time interval.
- Syslog messages’ content will contain all the details about the syslog message as well as the details about the sender, timestamps and so on.
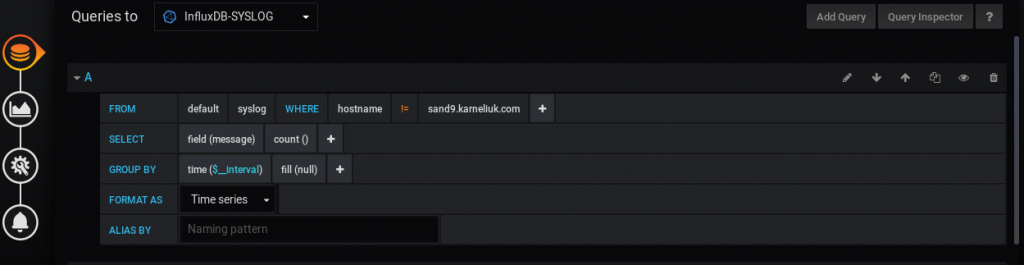
Let’s start with the first graph. To build it, we create the following query in Grafana:

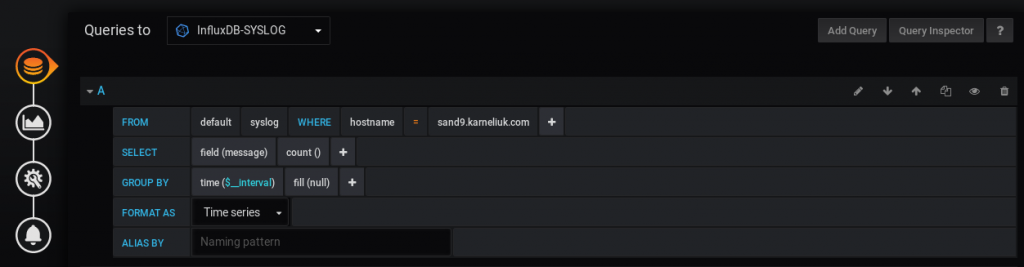


Basically, we just count the number of the messages received in the certain time interval. Pay attention to the Queries to field, as it must match the syslog data source. Such a query builds the following graph:

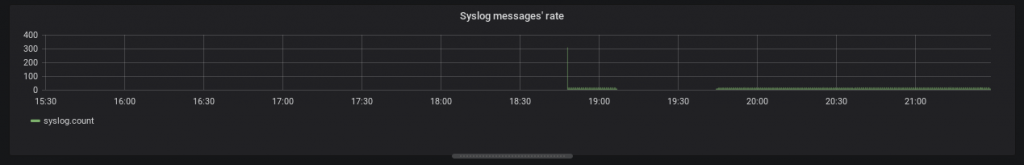
The graph isn’t fancy, as the there are not too many things happing in the network. There is a huge spike at the beginning caused by the fact that all the Docker containers were launched almost simultaneously. The other syslog messages are related to the routine of the containers: polling SNMP counters, writing to the InfluxDB over REST API and so on.
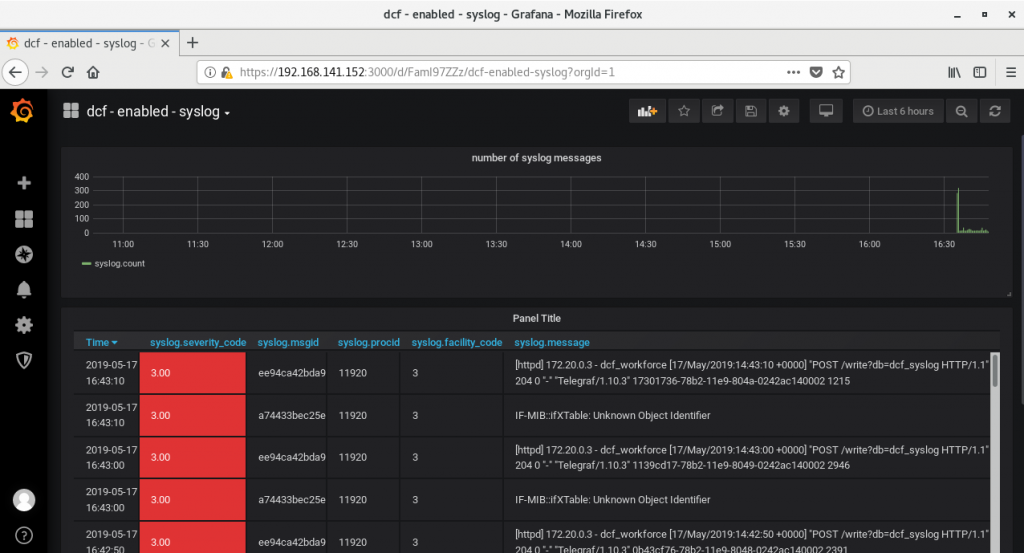
The second graph, as said, will show the content of the logs. The following quire constructs it:

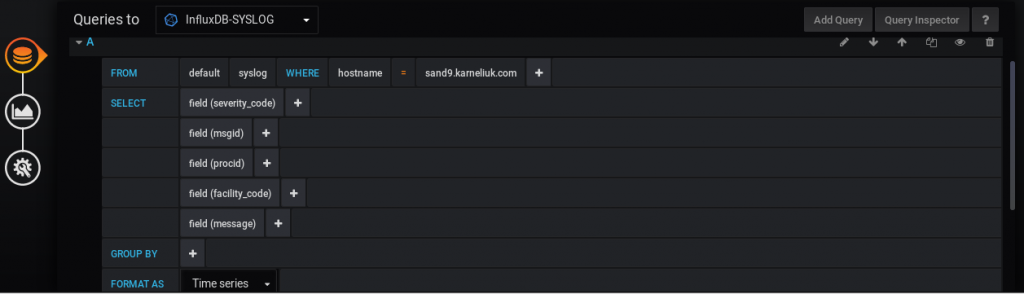
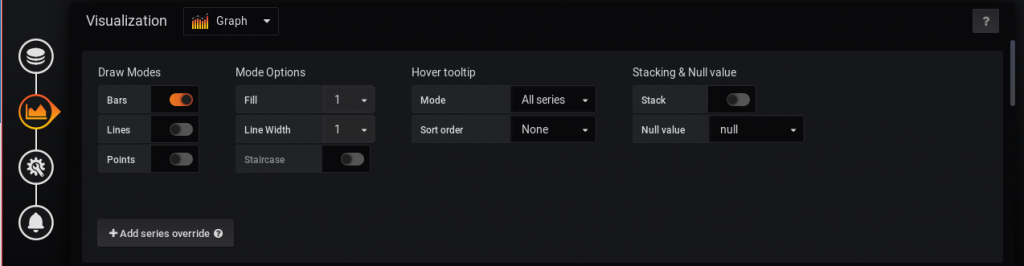
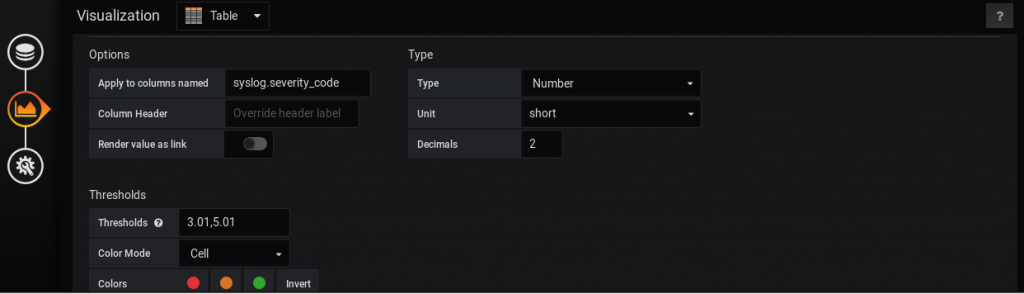
We define here the fields, which we want to see. It’s also necessary to remove anything from Group By field. It took me quite a bit of time, before I understood that it was preventing me to see the content of the messages. On the next tab we need to choose the Table visualization option with Time series to columns transformation:


On the same tab, just scrolling down we come to Column styles part. There we create a new style for the column called syslog.severity_code, where we configure thresholds and colour mode options:
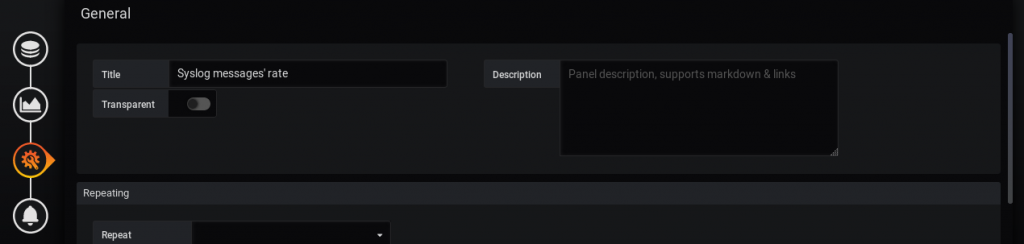
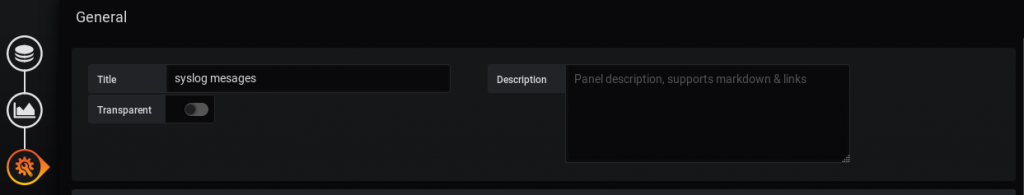
On the last tab, we define just a name for the graph:

The resulting graph based on the configuration above looks like as follows:

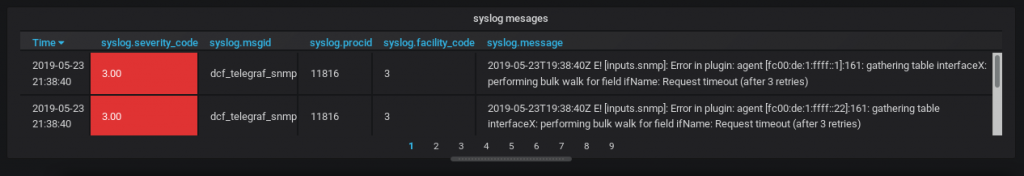
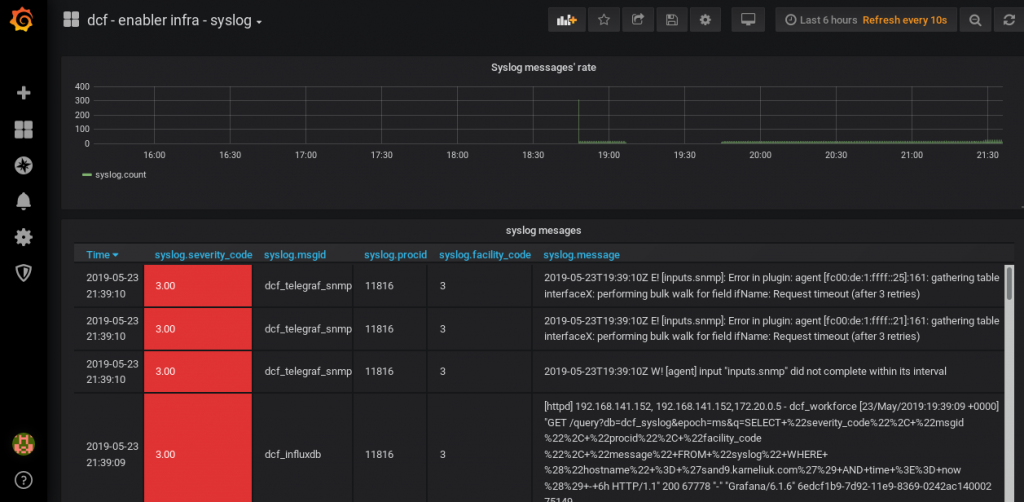
You see the timestamps, severity code (coloured using column style), msgid (equal to the configured tag) , process ID, facility and message itself. Perhaps, the process ID and facility code could be removed, as I don’t use them somehow. All in all, we have the following dashboard with the Syslog information:

The JSON file with this Dashboard you can get on my GitHub page.
By this time, we are done with the syslog for the Docker containers. Therefore, we can move to the Data Centre Fabric switches.
#7. Modification of the Cumulus Linux to syslog remotely and using RFC5424
Generally, the configuration of the syslog on the Cumulus Switches can be easily and achieved just using a single command as it’s described in the official Cumulus documentation:
In the same document it’s stated, that in case we want to send the syslog messages over VRF, the configuration can’t be created using NCLU tool and we need to switch to Linux-based approach using configuration files and daemons. In the same documentation the Cumulus explains that for VRF-based syslog, we need to create a file within the /etc/rsyslog.d/ directory with somewhat low index, for instance /etc/rsyslog.d/11-remotesyslog.conf. The reason, why we put the low index for this rule, is that the messages already logged to any other destination (critical, etc) won’t be replicated to the syslog destination. So we create the mentioned configuration file as follows:
2
action(type="omfwd" Target="192.168.1.1" Template="RSYSLOG_SyslogProtocol23Format" Device="mgmt" Port="514" Protocol="udp")
All the information besides template is the self-explanatory and provided in the built-in example /etc/rsyslog.d/11-remotesyslog.conf. However, the template parameter is important is very important in conjunction with Telegraf. By default, Cumulus Linux uses RFC 3164 to syslog the messages, what is not compatible with the Telegraf syslog client. Thanks to the rsyslog documentation, I have found the proper template RSYSLOG_SyslogProtocol23Format, which is:
2
3
4
5
IETF’s internet-draft ietf-syslog-protocol-23, which is
very close to the actual syslog standard RFC5424 (we
couldn’t update this template as things were in production
for quite some time when RFC5424 was finally approved).
After the mentioned configuration file is created, you need to restart the rsyslog daemon in order the configuration changes take place:
2
3
4
5
6
7
8
9
10
11
12
13
14
cumulus@de-bln-leaf-111:mgmt-vrf:~$ sudo systemctl status rsyslog.service
● rsyslog.service - System Logging Service
Loaded: loaded (/lib/systemd/system/rsyslog.service; enabled)
Active: active (running) since Fri 2019-05-24 15:47:11 UTC; 14s ago
Docs: man:rsyslogd(8)
http://www.rsyslog.com/doc/
Main PID: 1577 (rsyslogd)
CGroup: /system.slice/rsyslog.service
└─1577 /usr/sbin/rsyslogd -n
May 24 15:47:11 de-bln-leaf-111 systemd[1]: Started System Logging Service.
Such a modification should be applied to all the Cumulus switches we have.
Tests with Cisco IOS XR, Nokia SR OS and even Arista EOS were not successful due to the fact I wasn’t able to change the syslog format from RFC3164 to 5424.
#8. Building Grafana dashboards to monitor logs from the Data Centre Fabric running Cumulus Linux
The final step in this lab in terms of manual integration of the syslog monitoring from the Cumulus Linux with Telegraf/InfluxDB/Grafana is to create the dashboards. In a nutshell, the approach and query are quite similar to the one, we’ve used earlier for the Docker container syslog, though there are some changes. Let’s start with the first graph which counts the number of messages:

Only the query is provided as the rest, as the rest of the tables, such as visualization doesn’t deviate from the same graph for the Docker syslog. The specific here is that we count all the syslog messages besides the messages from sand9.karneliuk.com, which is host with the Docker containers. This is achieved by filtering the messages using “WHERE hostname != sand9.karneliuk.com” condition. The graph constructed with this query looks like as follows:

The second graph is related to the messages themselves. Again, I will show only the query, as the rest part were also shown earlier in the Docker part:

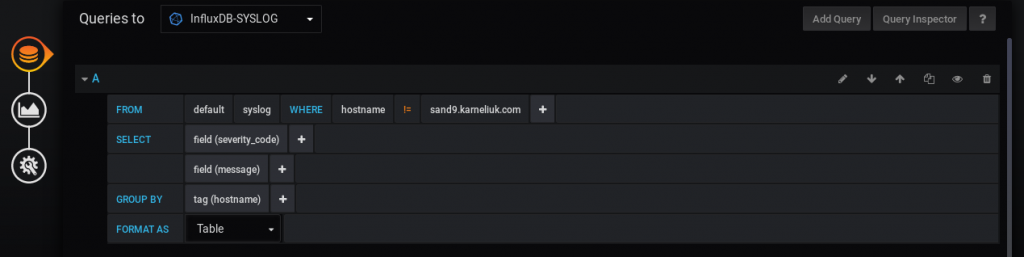
We apply the same filtering condition as in the previous graph in order to collect only appropriate syslog messages. From the field itself, we use severity_code and message. What is different here comparing to the same graph in Docker part, is that we set GROUP BY to tag (hostname) in order to add the hostname field to the graph, otherwise we wouldn’t be able to identify, which device sends this or that log message. We also set the FORMAT AS to Table. With all these manipulations, we get the following resulting chart:

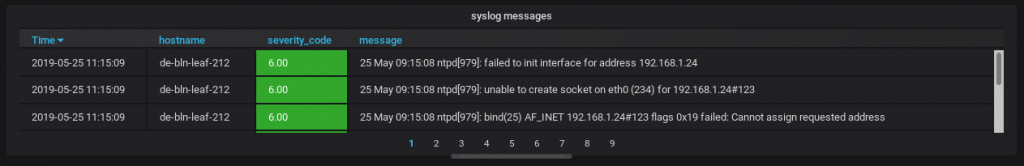
As said, the visualization parameters are explained above.
The overall panel for syslog information from the Cumulus Linux IP fabric looks like as follows:

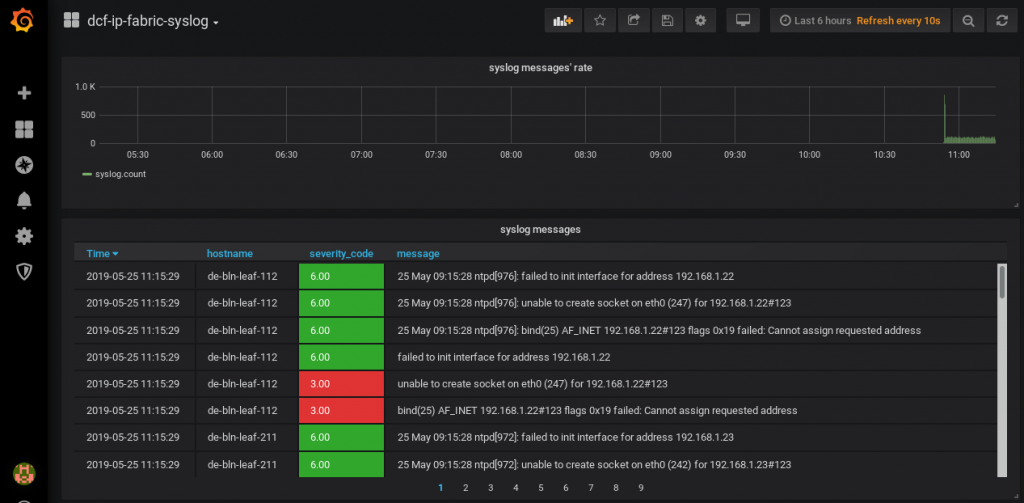
Oh, I see some issues with ntp, as I haven’t reconfigured it for VRF… Will fix that J That’s exactly the case, why we need to have the syslog from all the network functions and applications! You can download this Dashboard on my GitHub page.
Automating the infrastructure enabler and monitoring stack using Ansible
Though the installation of the monitoring and enabler stack in the live network is most likely one time activity, but in the lab environment, like mine, it’s very frequent task. That’s why I’ve automated this process. In the previous article we have reviewed the automation of the enabler infrastructure services such as DHCP, DNS, FTP and HTTP. Today we just extend that Ansible role with some additional containers:
2
3
4
5
6
7
8
9
10
11
12
13
14
15
16
17
18
19
20
21
22
23
24
25
26
27
28
29
30
31
32
33
34
35
36
37
38
39
40
41
42
43
44
45
46
47
48
49
50
51
52
53
54
---
- name: CREATING FOLDER FOR ALL CONTAINERS
file:
dest: "{{ docker.path_to_containers }}"
state: directory
tags:
- infra_enabler_install
- name: GETTING PWD
command: pwd
register: pwd
tags:
- infra_enabler_install
- infra_enabler_ops
- name: SETTING PWD VARIABLE
set_fact:
pwd_actual: "{{ pwd.stdout }}"
tags:
- infra_enabler_install
- infra_enabler_ops
- name: STARTING COLLECTION LOOP ...
include_tasks: collection_loop.yml
tags:
- infra_enabler_install
- infra_enabler_ops
- name: CREATING USER-DEFINED DOCKER NETWORK
shell: "docker network create {{ docker.private_network.name }} {% if docker.private_network.ipv6 %}--ipv6{% endif %} {% if docker.private_network.subnet is defined %}--subnet {{ docker.private_network.subnet }}{% endif %} {% if docker.private_network.gateway is defined %}--gateway {{ docker.private_network.gateway }}{% endif %}"
ignore_errors: yes
become: yes
tags:
- infra_enabler_install
- infra_enabler_ops
- name: BUILDING CONTAINERS ...
include_tasks: "container_{{ container_item }}.yml"
loop:
- dcf_influxdb
- dcf_telegraf_syslog
- dcf_telegraf_snmp
- dcf_grafana
- dcf_dhcp
- dcf_dns
- dcf_ftp
- dcf_http
loop_control:
loop_var: container_item
tags:
- infra_enabler_install
- infra_enabler_ops
...
All the details about this role you can find in the corresponding article.
There are two things new in the provided role:
- The user-defined Docker bridge is created during the installation or launch of the containers. In case the bridge already exists, we received the error, but using ignore_errors key the role’s execution is continued.
- All the monitoring containers (InfluxDB, 2x Telegraf, and Grafana ) are launched before the infrastructure services (DHCP, DNS, FTP, and HTTP).
The structure of the monitoring containers is described in the Secured monitoring for Service Provider Fabric.
In the ansible/README.md you can find the details about launch of the enabler infrastructure. Here is the example of the first launch of the enabler/monitoring infrastructure, when the containers are build:
2
3
4
5
6
7
8
9
10
11
12
13
14
15
16
17
18
19
20
21
22
23
24
PLAY [localhost] ***************************************************************************************************************************
TASK [Gathering Facts] *********************************************************************************************************************
ok: [localhost]
TASK [cloud_enabler : CREATING FOLDER FOR ALL CONTAINERS] **********************************************************************************
changed: [localhost]
TASK [cloud_enabler : GETTING PWD] *********************************************************************************************************
changed: [localhost]
! OUTPUT IS OMITTED
TASK [cloud_enabler : CONTAINER WITH dcf_http // TEMPLATING CUMULUS SYSLOG] ****************************************************************
changed: [localhost]
TASK [cloud_enabler : CONTAINER WITH dcf_http // TEMPLATING ARISTA ZTP SCRIPT] *************************************************************
changed: [localhost]
TASK [cloud_enabler : CONTAINER WITH dcf_http // LAUNCHING CONTAINER] **********************************************************************
changed: [localhost]
PLAY RECAP *********************************************************************************************************************************
localhost : ok=84 changed=60 unreachable=0 failed=0 skipped=0 rescued=0 ignored=1
You can verify that all the necessary Docker containers are up and running as follows:
2
3
4
5
6
7
8
9
10
11
12
13
14
15
CONTAINER ID IMAGE COMMAND CREATED STATUS PORTS NAMES
41a6407b5fdb akarneliuk/dcf_http "nginx" 2 minutes ago Up 2 minutes 0.0.0.0:80->80/tcp dcf_http
6ae348183cbe akarneliuk/dcf_ftp "/usr/sbin/vsftpd /e…" 2 minutes ago Up 2 minutes 0.0.0.0:20-21->20-21/tcp, 0.0.0.0:50000-50050->50000-50050/tcp dcf_ftp
74fbff859a88 akarneliuk/dcf_dns "/usr/sbin/named -f …" 2 minutes ago Up 2 minutes 192.168.1.1:53->53/tcp, 192.168.1.1:53->53/udp dcf_dns
512f44999083 akarneliuk/dcf_dhcp "/usr/sbin/dhcpd -4 …" 2 minutes ago Up 2 minutes dcf_dhcp
507530c1f257 grafana/grafana "/run.sh" 2 minutes ago Up 2 minutes 0.0.0.0:3000->3000/tcp dcf_grafana
f6cecec534c7 telegraf "/entrypoint.sh -con…" 3 minutes ago Up 2 minutes 8092/udp, 0.0.0.0:161->161/udp, 8125/udp, 8094/tcp dcf_telegraf_snmp
dbf9b33e2d03 telegraf "/entrypoint.sh -con…" 3 minutes ago Up 3 minutes 8092/udp, 0.0.0.0:514->514/udp, 8125/udp, 8094/tcp dcf_telegraf_syslog
8465a142c3b4 influxdb "/entrypoint.sh -con…" 3 minutes ago Up 3 minutes 0.0.0.0:8086->8086/tcp dcf_influxdb
966af014eef0 nginx:1.15-alpine "nginx -c /etc/netbo…" 2 weeks ago Up About an hour 80/tcp, 0.0.0.0:32768->8080/tcp netboxdocker_nginx_1
cc2a23b775e4 netboxcommunity/netbox:latest "/opt/netbox/docker-…" 2 weeks ago Up About an hour netboxdocker_netbox_1
a2ebe9de543a netboxcommunity/netbox:latest "python3 /opt/netbox…" 2 weeks ago Up About an hour netboxdocker_netbox-worker_1
7dbf613f4b5f redis:4-alpine "docker-entrypoint.s…" 2 weeks ago Up About an hour 6379/tcp netboxdocker_redis_1
45548530986d postgres:10.4-alpine "docker-entrypoint.s…" 2 weeks ago Up About an hour 5432/tcp netboxdocker_postgres_1
We are done. All our monitoring/enabler infrastructure applications running as Docker containers are monitored via syslog, which is collected via Telegraf into InfluxDB and displayed in Grafana.
All the lab files including Dockerfile and Ansible playbooks you can find on my GitHub page.

Lessons learned
The development of the solutions is very exciting process, at least for me. There are so many things, which might happen and you need to be able to mitigate them.
The first such case in this lab was the necessity to add the tag to the Docker containers. Without tag the configured, it isn’t easy to read the syslog, as you don’t know, which application sends it:

The second case was related to the different syslog format. Though it seems to be quite an old protocol, I was surprised that the Telegraf SNMP plugin can’t collect it due to format mismatch. It’s possible to write some custom application or scripts to translate the syslog messages from RFC 3164 to RFC 5424 format, though it isn’t implemented in the Telegraf directly. I hope, the support will be added in future, though it isn’t yet there.
Conclusion
In this article we’ve reviewed how to collect the logs from the Docker containers and from Cumulus Linux. Actually, we could have collected it from the Cisco IOS XR, Nokia SR OS ad Arista EOS, but they support legace BSD syslog format based on RF 3164, whereas the Telegraf understand only RF5424 format as of today. In the next article I will show you how to close the loop of the provisioning cycle Take care and good bye!
Support us
P.S.
If you have further questions or you need help with your networks, I’m happy to assist you, just send me message. Also don’t forget to share the article on your social media, if you like it.
BR,
Anton Karneliuk