Tools 12. Using Prometheus with SNMP Exporter to Monitor Cisco IOS XR, Nokia SR OS and Arista EOS Network Devices Anton KarneliukAutomationJanuary 15, 2023 Dear friend, Awareness of what is happening in your IT infrastructure (in our case, in network) is a key success or failure factor of any modern business, as huge majority of businesses are now running online. The awareness is built … Continue reading
Tools 11. Running Prometheus Exporters on Dis-aggregated Data Center Switches (Cisco NX-OS, NVIDIA Cumulus Linux, Arista EOS) Anton KarneliukAutomationAugust 1, 2022 Hello my friend, Monitoring is a key component of any IT and network systems, as it gives us possibility to … Continue reading
Tools 9. Monitoring Availability of Customers via HTTP GET, ICMP, and DNS via Dockerised Prometheus Anton KarneliukNetworkingMarch 20, 2022 Hello my friend, in the previous blogpost we’ve started the discussion how you can improve your customers’ experience in your … Continue reading
Tools 8. Monitoring Network Performance with Dockerised Prometheus, Iperf3 and Speedtest Anton KarneliukNetworkingMarch 13, 2022 Hello my friend, in the time when the business is conducted online, it is vital to have a clear visibility … Continue reading
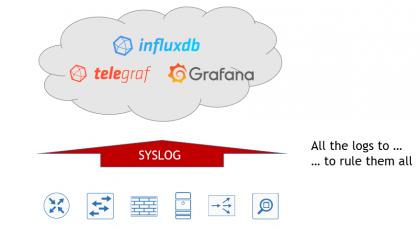
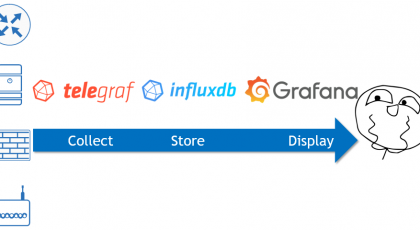
DC/SP. Part 12/7. Monitoring logs from Docker containers and network functions (Cumulus, Cisco, Arista, Nokia) using Telegraf, InfluxDB and Grafana Anton KarneliukNetworkingMay 28, 2019 Hello my friend, Within the Service Provider Project some time ago we’ve reviewed on of the most popular and robust … Continue reading2
SP. Part 6. Secured monitoring of multivendor Service Provider Fabric with Telegraf, InfluxDB and Grafana running as Docker containers and automated with Ansible Anton KarneliukNetworkingMarch 13, 2019 Hello my friend, In the previous article we have shown, how to collect information about network health using SNMPv3. Today … Continue reading4