

Hello my friend,
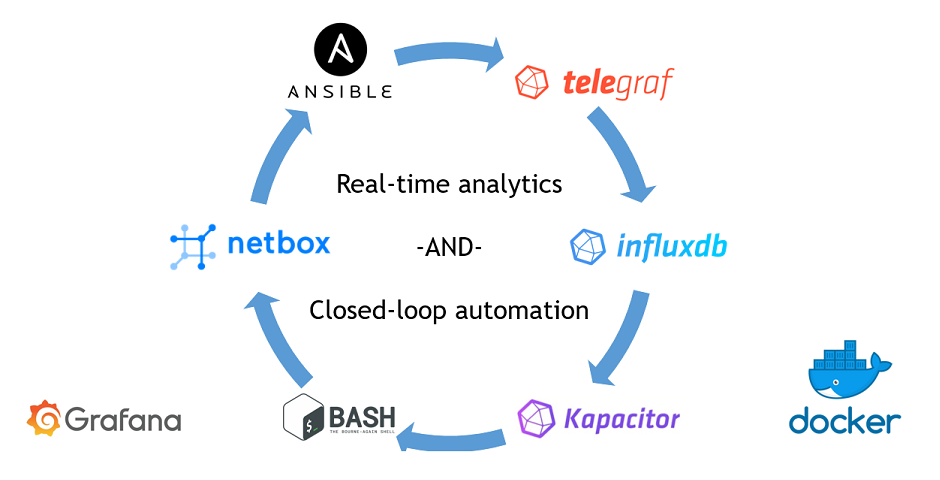
This article is kind of a special one for me. It doesn’t mean that everything I have written before has a little sense. Everything what I have written about the Data Centre Fabric project was steps towards fully automated data centre operation, and today we make a final step towards the closed-loop automation based using the real-time data analytics by InfluxData Kapacitor.
2
3
4
5
retrieval system, or transmitted in any form or by any
means, electronic, mechanical or photocopying, recording,
or otherwise, for commercial purposes without the
prior permission of the author.
Brief description
According to the official website, InfluxData Kapacitor is alerting system following publish-subscribe design pattern, which supports both steam and batch data processing. If we translate it from the geeks’ language, it means that Kapacitor can subscribe to a certain to topics in the data producer (e.g., time series database – InfluxDB or collector – Telegraf) and start getting information out of it:
- Steam processing means that all the information coming to the subscribed topic is automatically replicated to Kapacitor without additional computing load on the producer (resulting in more computing load to analyse this information on Kapacitor)
- Batch processing means that Kapacitor sends on defined basis the query to the producer (applicable only to TSDB producer) using a proper syntax. This creates less load on the Kapacior, but put more load on the TSDB to process the queries. Additionally, obviously, the batch processing isn’t real-time.
There is no good and bad processing. I’d say, they are just needed for different use cases. Hence, both are equally important.
In a nutshell, the term processing mean that the Kapacitor becomes some data, either in string or numeric format, analyse it based on the rules defined by you, and do some actions with this data. The action could be something like data processing, or triggering some external actions. The latter is a key to the closed-loop telemetry: we analyse the data collected from the network functions and applications in a certain way, and if we find the matching patterns, we automatically triggers the set of actions based on our business logic. The following image intents to help you understand, what closed-loop automation is:
2
3
4
5
6
7
8
9
10
11
12
13
14
15
16
17
| |
| +-----+ NO mathches for a certain pattern |
| | | DO NOTHING |
| +------------+ +---v-----+---+ |
| | | | | |
| | Controlled +--------------->+ Real-time | |
| | | Information: | analytics | |
| | system | - Logs | (Kapacitor) | |
| | | - Counters | | |
| +------^-----+ - Telemtery +-----+-------+ |
| | | |
| | | MATCH for a certrain pattern |
| | | TRIGGER CORRECTIVE ACTION |
| +----------------------------+ |
| |
+-------------------------------------------------------------------------------+
This approach in general and InfluxData TICK (or in our case TIK – Telegraf, InfluxDB, Kapacitor) stack in particular create the engine for an automated network operation.
What are we going to test?
We are going to add InfluxData Kapaciotr as a Docker container to our Enabler stack (link), which we have extended with the monitoring capabilities recently (). Once it’s done, we will test the following things:
- Kapacitor should be able to analyse the stream of the numeric data and trigger some action based on that.
- Kapacitor should be able to analyse the stream of the textual data and trigger some actions based on the found pattern.
- Kapacitor should be able to perform batch requests, analyse the collected info and trigger actions.
The provided use cases are relatively high-level, so in the article later you will see the more detailed explanation of the related use cases.
Software version
The following software components are used in this lab.
Management host:
- CentOS 7.5.1804 with python 2.7.5
- Ansible 2.8.0
- Docker-CE 18.09
- Containerized NetBox
Enabler and monitoring infrastructure:
- Base Linux image for container: Alpine Linux 3.9
- DHCP: ISC DHCP 4.4.1-r2
- DNS: ISC BIND 9.12.3_p4-r2
- FTP: VSFTPD 3.0.3-r6
- HTTP: NGINX 1.14.2-r1
- InfluxData Telegraf: 1.10.3
- InfluxData TSDB: 1.7.6
- Grafana: 6.1.6
- InfluxData Kapacitor: 1.5.2
The Data Centre Fabric:
- Nokia SR OS 16.0.R7 [guest VNF]
- Arista EOS 4.21.1.1F [guest VNF]
- Cisco IOS XR 6.5.1 [guest VNF]
- Cumulus Linux 3.7.5 [guest VNF]
More details about Data Centre Fabric you may find in the previous articles.
Topology
This is the management topology from the previous lab extended with four new containers:
2
3
4
5
6
7
8
9
10
11
12
13
14
15
16
17
18
19
20
21
22
23
24
25
26
27
28
29
30
31
| /\/\/\/\/\/\/\/\/\/\/\/\/\/\/\/\ |
| +-----------------+ +-----------------+ / +------+ +------+ Docker cloud \ |
| | de+bln+spine+101| (c)karneliuk.com // Data Centre Fabric | de+bln+spine+201| / |TELEG1| |TELEG2| +------+ \ |
| | (Cisco IOS XRv) | | (Nokia VSR) | \ +------+ +------+ +---+ DHCP | / |
| | Lo0: .1 | | system: .2 | / |.8 |.9 | .2+------+ \ |
| | BGP AS: 65000 | | BGP AS: 65000 | \ +-------------+ / |
| +-------+---------+ IP^4: 192.168.1.0/24 +--------+--------+ \ 172.17.0.0/16 | +------+ \ |
| | IPv6: fc00:de:1:ffff::/64 | \+------------+ +---+ DNS | / |
| | MgmtEth0/CPU0/0 | MgmtEth0/CPU0/0| Management +----+ .3+------+ \ |
| | .25/:25 | .26/:26 | host |.1 | / |
| | | +------+-----+ | +------+ \ |
| | | | \ +---+ FTP | / |
| | | | ens33\ | .4+------+ \ |
| +-------------------+--------------+---------------------------------+-------------+-------------------+---+ .137 \ | / |
| | | | | :137 / | +------+ \ |
| | | | | \ +---+ HTTP | / |
| | | | | \ | .5+------+ \ |
| | eth0 | eth0 | Management1 | Management1/ | / |
| | .21/:21 | .22/:22 | .23/:23 | .24/:24 \ | +------+ \ |
| | | | | / +---+INFLUX| / |
| +------------------+ +---------+--------+ +---------+--------+ +---------+--------+ \ | .6+------+ \ |
| | de+bln+leaf+111 | | de+bln+leaf+112 | | de+bln+leaf+211 | | de+bln+leaf+212 | / | / |
| | (Cumulus VX) | | (Cumulus VX) | | (Arista vEOS) | | (Arista vEOS) | \ | +------+ \ |
| | lo: .101 | | lo: .102 | | Lo0: .104 | | Lo0: .105 | / +---+GRAFAN| / |
| | BGP AS: 65101 | | BGP AS: 65102 | | BGP AS: 65104 | | BGP AS: 65105 | \ | .7+------+ \ |
| +------------------+ +------------------+ +------------------+ +------------------+ / | +------+ / |
| \ +---+KAPACI| \ |
| \ .10+------+ / |
| \/\/\/\/\/\/\/ |
+--------------------------------------------------------------------------------------------------------------------------------------------------+
You can use any hypervisor of your choice (KVM, VMWare Player/ESXI, etc) to run guest VNFs. For KVM you can use corresponding cheat sheet for VM creation.
Comparing to the previous version of the management network in the Data Centre Fabric, there is only one new Docker container running the InfluxData Kapacitor inside.
There is no single change in the Data Centre Fabric itself comparing to the previous lab:
2
3
4
5
6
7
8
9
10
11
12
13
14
15
16
17
18
19
20
21
22
23
24
25
26
27
28
29
30
31
| |
| +-----------------+ +-----------------+ |
| | de-bln-spine-101| (c)karneliuk.com // Data Centre Fabric | de-bln-spine-201| |
| | (Cisco IOS XRv) | | (Nokia VSR) | |
| | Lo0: .1 | | system: .2 | |
| | BGP AS: 65000 | IPv4 links: 169.254.0.0/24 eq 31 | BGP AS: 65000 | |
| +--+---+---+---+--+ IPv6 loopb: 10.1.1.0/24 eq 32 +--+---+---+---+--+ |
| |.0 |.4 |.8 |.12 IPv6 links: fc00:de:1:0::/64 eq 127 |.2 |.6 |.10|.14 |
| +-----------------+:0 |:4 |:8 |:c IPv6 loopb: fc00:de:1:1::/64 eq 128 |:2 |:6 |:a |:e |
| | | | | | | | | |
| | +------------------------------------------------------------------------+ | | | |
| | | | | | | | | |
| | | +-----------+ +------------------------------------------+ | | |
| | | | | | | | | |
| | | +-----------------------------------------+ +------------+ +----------------+ |
| | | | | | | | | |
| | | +-----------------------------------------------------------------------+ | |
| | | | | | | | | |
| | swp3 | swp4 | swp3 | swp4 | Eth3 | Eth4 | Eth3 | Eth4 |
| | .1/:1| .3/:3 | .5/:5| .7/:7 | .9/:9| .11/:b |.13/:d| .15/:f |
| +-----+------+-----+ +-----+------+-----+ +-----+------+-----+ +-----+------+-----+ |
| | de-bln-leaf-111 +--------------+ de-bln-leaf-112 | | de-bln-leaf-211 +--------------+ de-bln-leaf-212 | |
| | (Cumulus VX) | swp1 swp1 | (Cumulus VX) | | (Arista vEOS) | Eth1 Eth1 | (Arista vEOS) | |
| | lo: .101 | | lo: .102 | | Lo0: .104 | | Lo0: .105 | |
| | BGP AS: 65101 +--------------+ BGP AS: 65102 | | BGP AS: 65104 +--------------+ BGP AS: 65105 | |
| +--+------------+--+ swp2 swp2 +--+------------+--+ +--+------------+--+ Eth2 Eth2 +--+------------+--+ |
| | | | | | | | | |
| + + Anycast IP: .100 + + + + Anycast IP: .103 + + |
| |
+--------------------------------------------------------------------------------------------------------------------------------+
If you need more details on the topology explanation, refer to the previous article.
As there are no changes comparing to the previous lab, then there is nothing new to describe, so we proceed further.
The topologies and initial configuration files you can find on my GitHub.
The algorithm of the closed-loop automation for the Data Centre Fabric
In a nutshell, Kapacitor utilizes something called the TICK scripts to perform any kind of analyses and automatic action. Basically the TICK script is a piece of code, which defines the way, how the information is gathered (stream or batch query), transformed and analysed. The closed-loop automation is an inherited part of the analysis, where the certain action is atomically launched based on the matching condition. For example, such a condition could be the crossing of the certain threshold for numeric values or finding some pattern in the text information based on the regex. In terms of the automated actions, there are also a plenty of possibilities, like the launch of the Python script, REST API call and many others. The TICK scripts consists of the nodes, which are chained together. It looks like as follows:
Each node performs some action, like collect information, compare it, process it, etc. Then output of the execution of the node is chained to the input of another node using “|” symbol. You can think about it as the pipelines in Linux, where you have provide the STDOUT of one command to STDIN to another command, when you connect them using pipe “|”.
Typically, the first one defines the type of the input information, whether it’s stream or batch. The rest of the nodes are common for both types of information collection.
Before we can explain the details of the TICK scripts, we need to prepare infrastructure first.
#1. Deploying Kapacitor as a Docker container
The prerequisite of the following description is that you have operational setup of the Data Centre Fabric Enabler Stack from the previous lab.
Kapacitor, like any other InfluxData application, could be installed as a Linux application directly in your operation system, but we don’t use this approach. Like all other applications within our Data Centre Fabric Enabler Stack, we install it using Docker.
But before we launch the container for operation , we need to get a configuration file first:
2
2019/06/07 13:49:03 Merging with configuration at: /etc/kapacitor/kapacitor.conf
This file is a core configuration for the application, exactly in the same way as for Telegraf and InfluxDB.
We will change its content in a minute, but for now, we don’t touch it. Instead, we launch the Docker container with Kapacitor with the default configuration configuration:
2
3
4
5
6
7
8
9
-v $PWD/data/scripts:/home/kapacitor/scripts \
-v $PWD/data/var_lib_kapacitor:/var/lib/kapacitor \
-v $PWD/data/exec:/tmp/exec \
-v $PWD/kapacitor.conf:/etc/kapacitor/kapacitor.conf:ro \
--network mon_net \
--add-host "sand9.karneliuk.com:172.17.0.1" \
--name dcf_kapacitor \
kapacitor -config /etc/kapacitor/kapacitor.conf
We don’t integrate it directly with the syslog to have possibility to track what is going during the development stage.
You see some additional flags needed for the container to works correctly:
- –v for the persistence data storage.
- ––add-host to add the hostname of the management host (or the hostname of the Docker container with the Ansible). This will be necessary for a keyless SSH access from the Kapacitor container to trigger the Ansible playbook remotely.
- ––network with the name of the user-define Docker bridge
- ––name with the name of the Docker container.
All the components aren’t new for you, for instance add-host key was used earlier in the Service Provider Monitoring and the user-defined Docker bridge was used in the previous article.
The user-defined Docker bridge has one awesome function, which makes it particularly useful for such a setup with multiple Docker containers. This function is a built-in DNS server. All the Docker containers upon creation get the randomly generated hostnames. Having the DNS resolutions working within the user-defined bridge allows the containers communicate to each other using both IPv4/IPv6 addresses and the hostnames. The good thing is that you don’t need to configure this function and it works automatically. The reason, why it’s important, is the way, how the Kapacitor makes the subscription to the InfluxDB. Later on, you will see some outputs, but generally it registers with the hostname, meaning that the InfluxDB needs to do the resolution of the Kapacitor hostname to its IP address, when it streams the data to the Kapacitor.
Meanwhile our container with Kapacitor is started and we can see some logs showing what is going on inside:
2
3
4
5
6
7
8
9
10
11
12
13
14
15
16
17
18
19
20
21
22
23
24
25
26
27
28
29
2019/06/07 13:53:07 Using configuration at: /etc/kapacitor/kapacitor.conf
ts=2019-06-07T13:53:07.437Z lvl=info msg="kapacitor starting" service=run version=1.5.2 branch=HEAD commit=3086452d00830e01d932838d8c6d1df818648ad3
ts=2019-06-07T13:53:07.437Z lvl=info msg="go version" service=run version=go1.11.2
ts=2019-06-07T13:53:07.437Z lvl=info msg="listing Kapacitor hostname" source=srv hostname=dd7eac3e842b
ts=2019-06-07T13:53:07.437Z lvl=info msg="listing ClusterID and ServerID" source=srv cluster_id=711dceb0-37c4-41bf-a91b-cb4a5491e1b3 server_id=60ddf84e-be11-4550-9621-94c13db51457
ts=2019-06-07T13:53:07.437Z lvl=info msg="opened task master" service=kapacitor task_master=main
ts=2019-06-07T13:53:07.438Z lvl=debug msg="opening service" source=srv service=*storage.Service
'##:::'##::::'###::::'########:::::'###:::::'######::'####:'########::'#######::'########::
##::'##::::'## ##::: ##.... ##:::'## ##:::'##... ##:. ##::... ##..::'##.... ##: ##.... ##:
##:'##::::'##:. ##:: ##:::: ##::'##:. ##:: ##:::..::: ##::::: ##:::: ##:::: ##: ##:::: ##:
#####::::'##:::. ##: ########::'##:::. ##: ##:::::::: ##::::: ##:::: ##:::: ##: ########::
##. ##::: #########: ##.....::: #########: ##:::::::: ##::::: ##:::: ##:::: ##: ##.. ##:::
##:. ##:: ##.... ##: ##:::::::: ##.... ##: ##::: ##:: ##::::: ##:::: ##:::: ##: ##::. ##::
##::. ##: ##:::: ##: ##:::::::: ##:::: ##:. ######::'####:::: ##::::. #######:: ##:::. ##:
..::::..::..:::::..::..:::::::::..:::::..:::......:::....:::::..::::::.......:::..:::::..::
ts=2019-06-07T13:53:07.441Z lvl=debug msg="opened service" source=srv service=*storage.Service
ts=2019-06-07T13:53:07.441Z lvl=debug msg="opening service" source=srv service=*noauth.Service
ts=2019-06-07T13:53:07.441Z lvl=debug msg="opened service" source=srv service=*noauth.Service
ts=2019-06-07T13:53:07.441Z lvl=debug msg="opening service" source=srv service=*config.Service
ts=2019-06-07T13:53:07.441Z lvl=debug msg="opened service" source=srv service=*config.Service
ts=2019-06-07T13:53:07.441Z lvl=debug msg="applying config overrides" source=srv
!
! OUTPUT IS OMITTED
!
ts=2019-06-07T13:55:53.215Z lvl=error msg="failed to connect to InfluxDB, retrying..." service=influxdb cluster=default err="Get http://localhost:8086/ping: dial tcp [::1]:8086: connect: connection refused"
ts=2019-06-07T13:56:29.116Z lvl=error msg="failed to connect to InfluxDB, retrying..." service=influxdb cluster=default err="Get http://localhost:8086/ping: dial tcp [::1]:8086: connect: connection refused"
Don’t be afraid by observing the errors. Kapacitor tries to connect to the InfluxDB by default, but as we run it within the separated container, Kapacitor doesn’t know, where to connect.
Before we will perform the integration with the InfluxDB, we need to perform some preparatory activities. As we are trying to secure everything, we need to create SSL-certificates for Kapacitor to communicate with the InfluxDB:
2
3
4
5
6
Generating a RSA private key
............................+++++
..........................................+++++
writing new private key to '/etc/ssl/influxdb-selfsigned.key'
-----
Once the certificates are created, we need to protect the Kapacitor REST API so that it’s exposed only over HTTPS, not a plain HTTP. To reach that we modify the configuration file as kapacitor.conf follows:
2
3
4
5
6
7
8
9
10
11
12
13
14
! OUTPUT IS OMITTED
[http]
bind-address = ":9092"
auth-enabled = false
log-enabled = true
write-tracing = false
pprof-enabled = false
https-enabled = true
https-certificate = "/etc/ssl/influxdb-selfsigned.crt"
https-private-key = "/etc/ssl/influxdb-selfsigned.key"
shutdown-timeout = "10s"
shared-secret = ""
! OUTPUT IS OMITTED
In the snippet above you can see that we set https-enabled to true (was false by default) and provider the valid paths to the PKI certificate and key. You can also change the default Kapacitor port 9092 to a different one, but we don’t do this. In order the configuration changes are applied, we need to restart the Kapacitor application or the Docker container generally in our case:
2
dcf_kapacitor
Now the Kapacitor would operate over the HTTPS and we can move further to integrate it with the InfluxDB
#2. Connecting Kapacitor with the InfluxData time-series data base (InfluxDB)
By default, Kapacitor tries to register itself with the InfluxDB and if it doesn’t happen within one minute, the container exists with the status 1:
2
3
4
5
6
7
8
9
10
! OUTPUT IS OMITTED
ts=2019-06-07T14:23:57.463Z lvl=error msg="encountered error" service=run err="open server: open service *influxdb.Service: failed to link subscription on startup: canceled"
run: open server: open service *influxdb.Service: failed to link subscription on startup: canceled
$ sudo docker container ls --all
CONTAINER ID IMAGE COMMAND CREATED STATUS PORTS NAMES
29a3eaa6d8c3 kapacitor "/entrypoint.sh -con…" 3 minutes ago Exited (1) 47 seconds ago dcf_kapacitor
! FURTHER OUTPUT IS OMITTED
That’s why the next logical step in our Kapacitor implementation is to connect it to the InfluxDB. To do that we need to provide the URL, credentials and subscription protocol on the Kapacitor configuration:
2
3
4
5
6
7
8
9
10
11
12
13
14
15
16
17
18
19
20
21
22
23
24
25
26
27
!OUTPUT IS OMITTED
[[influxdb]]
enabled = true
name = "default"
default = true
urls = ["https://172.20.0.2:8086"]
username = "dcf_workforce"
password = "dcf_w0rkf0rc3"
ssl-ca = ""
ssl-cert = ""
ssl-key = ""
insecure-skip-verify = true
timeout = "0s"
disable-subscriptions = false
subscription-protocol = "https"
subscription-mode = "cluster"
kapacitor-hostname = ""
http-port = 0
udp-bind = ""
udp-buffer = 1000
udp-read-buffer = 0
startup-timeout = "5m0s"
subscriptions-sync-interval = "1m0s"
[influxdb.excluded-subscriptions]
_kapacitor = ["autogen"]
! FURTHER OUTPUT IS OMITTED
We collect IP address of the InfluxDB container by docker container inspect dcf_docker command and put it here in the configuration file alongside with the standard InfluxDB port as urls parameter. As you have decided in the previous article (link), we created new username/password, which we provide here. Additionally, we put insecure-skip-verify to true, due to the fact we use the self-signed certificates. What is important here, we set the subscription-protocol to https, to make the communication for the subscription data also protected.
The configuration for the subscription-protocol is to be also updated in the configuration file of the InfluxDB:
2
3
4
5
6
7
8
9
10
! OUTPUT IS OMITTED
[subscriber]
enabled = true
http-timeout = "30s"
insecure-skip-verify = true
ca-certs = ""
write-concurrency = 40
write-buffer-size = 1000
! FURTHER OUTPUT IS OMITTED
Here we put insecure-skip-verify to true, as we have just explained, we are using self-signed certificates.
After the changes are done, don’t forget to restart containers!
When the containers with Kapacitor and InfluxDB are back, we can see that now the subscription looks like fine:
2
3
4
ts=2019-06-07T14:56:01.387Z lvl=error msg="error while sending usage report on startup" service=reporting err="Post https://usage.influxdata.com/api/v1/usage/kapacitor: dial tcp 104.131.151.204:443: connect: connection refused"
ts=2019-06-07T14:56:40.292Z lvl=debug msg="linking subscription for cluster" service=influxdb cluster=default cluster=default
ts=2019-06-07T14:57:40.292Z lvl=debug msg="linking subscription for cluster" service=influxdb cluster=default cluster=default
On the InfluxDB we can check that the Kapacitor is subscribed to the topics (actually, it subscribes to all available databased by default):
2
3
4
5
6
7
8
9
10
11
12
13
14
15
16
17
18
19
20
21
22
23
24
25
26
27
28
29
30
31
32
33
34
35
36
37
38
39
40
41
42
43
44
45
46
47
48
49
50
51
52
53
54
55
56
57
58
59
60
61
62
63
64
65
66
67
{
"results": [
{
"statement_id": 0,
"series": [
{
"name": "dcf_snmp",
"columns": [
"retention_policy",
"name",
"mode",
"destinations"
],
"values": [
[
"autogen",
"kapacitor-711dceb0-37c4-41bf-a91b-cb4a5491e1b3",
"ANY",
[
"https://29a3eaa6d8c3:9092"
]
]
]
},
{
"name": "dcf_syslog",
"columns": [
"retention_policy",
"name",
"mode",
"destinations"
],
"values": [
[
"autogen",
"kapacitor-711dceb0-37c4-41bf-a91b-cb4a5491e1b3",
"ANY",
[
"https://29a3eaa6d8c3:9092"
]
]
]
},
{
"name": "_internal",
"columns": [
"retention_policy",
"name",
"mode",
"destinations"
],
"values": [
[
"monitor",
"kapacitor-711dceb0-37c4-41bf-a91b-cb4a5491e1b3",
"ANY",
[
"https://29a3eaa6d8c3:9092"
]
]
]
}
]
}
]
}
The implication of the subscription protocol https you can see in the way that link to Kapacitor starts with https. In addition, as we mentioned in the beginning, Kapacitor subscribes to InfluxDB using the hostname. In this case you see the hostname 29a3eaa6d8c3, what equals to the hostname of the Kapacitor:
2
29a3eaa6d8c3
Kapacitor is subscribed to the InflxuDB and we can say that the stack for real-time analytics is ready. We can check if Kapacitor is OK using the REST API:
2
3
4
5
6
HTTP/1.1 204 No Content
Content-Type: application/json; charset=utf-8
Request-Id: 72ecdb38-8955-11e9-8013-000000000000
X-Kapacitor-Version: 1.5.2
Date: Fri, 07 Jun 2019 18:52:50 GMT
The only thing is missing is the possibility to trigger the Ansible playbooks on the remote node. That’s something we will focus on now.
#3. Connecting Kapacitor with a management host over SSH with keyless access mode
As of today, the Ansible playbooks are located on the management host (or they can be another container). To be able to do such a communication, we need to provide a capability for the Docker container to SSH to another node without manually entering the SSH password. This can be achieved by using the private/public SSH keys. This works as follows.
The first step is to install an SSH client on the Docker container with Kapacitor. I’ve learned, it’s a Debian, hence we go as follows:
2
3
4
5
6
7
8
9
10
11
12
13
14
debconf: delaying package configuration, since apt-utils is not installed
Selecting previously unselected package libapparmor1:amd64.
(Reading database ... 7873 files and directories currently installed.)
Preparing to unpack .../00-libapparmor1_2.11.0-3+deb9u2_amd64.deb ...
Unpacking libapparmor1:amd64 (2.11.0-3+deb9u2) ...
! OUTPUT IS OMITTED
Setting up ssh (1:7.4p1-10+deb9u6) ...
Setting up libdevmapper1.02.1:amd64 (2:1.02.137-2) ...
! OUTPUT IS OMITTED
debconf: falling back to frontend: Teletype
Processing triggers for libc-bin (2.24-11+deb9u4) ...
Processing triggers for sgml-base (1.29) ...
Processing triggers for dbus (1.10.26-0+deb9u1) ...
Once the ssh packages including all the dependencies is installed, we can proceed with the second step, which is is to generate the private/public SSH keys with the Kapacitor container:
The arguments to ssh-keygen are provided in a way to avoid any manual interaction, as it’s a particularly important for further automation with Ansible.
The third step is to copy the SSH public key to the destination host (the management host with Ansible in our case) to allow the container with Kapacitor to connect to it:
2
$ chmod 600 /home/aaa/.ssh/authorized_keys
As you can see, we not only copy the public key, but also change the permissions to access the file as r–. The latter is crucial, otherwise the keys won’t be utilized by the target host.
After all these manipulations are completed, we check that it works correctly:
2
sand9.karneliuk.com
In the snippet above, we execute on the management host sand9.karneliuk.com the command hostname, which is send over SSH with option to skip the key checking. We need explicitly to skip the key checking; otherwise, we would be required to interactively respond yes, what is impossible in closed-loop automation scenarios.
At this point, the Docker container with Kapacitor is ready to perform the closed-loop automatic actions based on the real-time analytics we’ve deployed earlier.
#4. Creating TICK script to analyse network events and trigger automatic actions
Finally we reach the core topic of this article, which are the TICK scripts themselves. For now we’ll focus on a single use case, which is a core component for the closed-loop automation of the Data Centre Fabric, whereas the two more use cases will be provided by the end of the articles in form of use case description together with resulting TICK script.
The use case for closed-loop automation for the Data Centre Fabric provisioning is the following:
- Once the network function registers on the DHCP server and starts the ZTP process, the Docker container with the DHCP application generates corresponding log message.
- This log message over SYSLOG is transferred to Telegraf, which puts the message to the InflxuDB.
- Kapacitor subscribes to listen for all SYSLOG entries in the InfluxDB (stream processing on Kapacitor).
- Once Kapacitor find the DHCPACK message, it triggers the Bash script.
- The Bash scripts parses the DHCPACK message to extract the IP address of the registered network function.
- Once the IP address is found, the Bash script launches on another container the Ansible playbook for provisioning of the dc_underlay role for a found IP address. The playbook was created earlier (link), but it is a bit modified to take into account possible external variable.
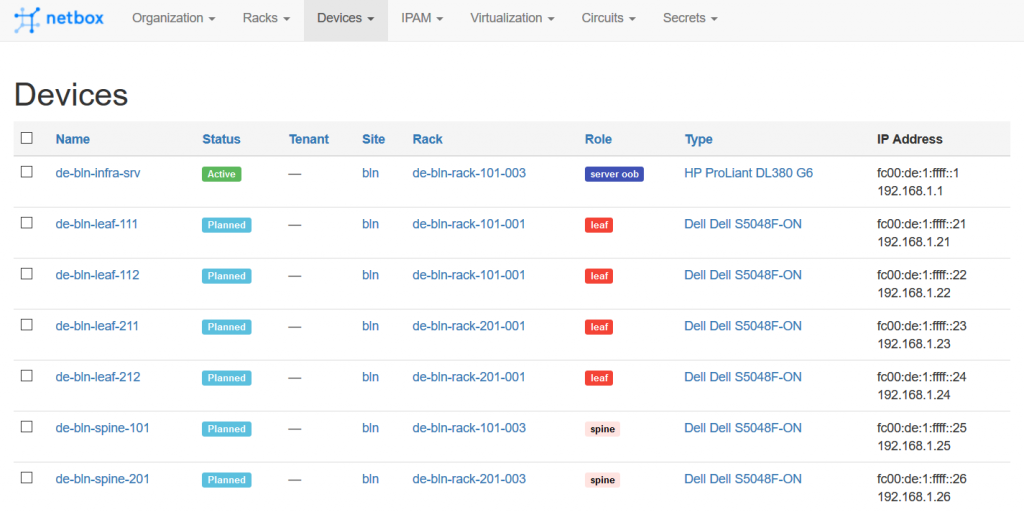
- To avoid the false positive provisioning cases, the documentation of the devices in the NetBox is changed. From now on, only the devices which are documented with status Planned are provisioned. If the device has any other status (e.g., Active), it is NOT provisioned.
- Once the provisioning is done, the status of the device in the NetBox is changed from Planned to Active.
Such algorithm leverages on the full Data Centre enabler stack we have created and intelligently utilize it for provisioning without avoiding the generation of the config files in advance. The Digital Ocean NetBox also plays a crucial role here, as it acts as a source of truth of the state of our network.
I hope, it sounds for you as exciting, as for me. Let’s deploy it!
However, we start a little softer. If we split the algorithm above based on the executors, the first four tasks are related to the TICK script. But before we can create the task, we need to understand, how to filter the proper SYSLOG messages. Earlier we have shown some examples, how to use the REST API of the InfluxDB, so we would extend these knowledge today.
First of all, let’s take a look on all the syslog messages:
2
3
4
5
6
7
8
9
10
11
12
13
14
15
16
17
18
19
20
21
22
23
24
25
26
27
28
29
30
31
32
33
"results": [
{
"statement_id": 0,
"series": [
{
"name": "syslog",
"columns": [
"time",
"message"
],
"values": [
[
"2019-06-07T13:35:16.311442742Z",
"2019-06-07T13:35:16Z I! Starting Telegraf 1.10.3"
],
[
"2019-06-07T13:35:16.311476001Z",
"2019-06-07T13:35:16Z I! Loaded inputs: snmp"
],
[
"2019-06-07T13:35:16.311486706Z",
"2019-06-07T13:35:16Z I! Loaded aggregators:"
],
[
"2019-06-07T13:35:16.311494596Z",
"2019-06-07T13:35:16Z I! Loaded processors:"
],
[
"2019-06-07T13:35:16.311501742Z",
"2019-06-07T13:35:16Z I! Loaded outputs: influxdb"
],
! FURTHER OUTPUT IS OMITTED
Details how to configure SYSLOG for Docker containers you can find in a dedicated article.
As you can see, there are a lot of information. Too much information, actually. The next step is to understand, how we can filter the output. As you have seen in the previous request, the syntax for the requests to the InfluxDB is SQL-like, which they call InfluxQL. After some investigations of the documentation, I have found the option to use the WHERE filter to get the output for SYSLOG messages generated by dcf_dhcp application:
2
3
4
5
6
7
8
9
10
11
12
13
14
15
16
17
18
19
20
21
22
23
24
25
26
27
28
29
30
31
32
33
34
35
36
37
38
39
40
41
42
43
44
{
"results": [
{
"statement_id": 0,
"series": [
{
"name": "syslog",
"columns": [
"time",
"message"
],
"values": [
[
"2019-06-07T13:35:35.022450044Z",
"Internet Systems Consortium DHCP Server 4.4.1"
],
[
"2019-06-07T13:35:35.022475008Z",
"Copyright 2004-2018 Internet Systems Consortium."
],
! OUTPUT IS OMITTED
[
"2019-06-07T17:35:16.328645812Z",
"DHCPDISCOVER from 52:54:00:06:05:00 via br0"
],
[
"2019-06-07T17:35:16.32870074Z",
"DHCPOFFER on 192.168.1.25 to 52:54:00:06:05:00 via br0"
],
[
"2019-06-07T17:35:16.328713102Z",
"DHCPREQUEST for 192.168.1.25 (192.168.1.1) from 52:54:00:06:05:00 via br0"
],
[
"2019-06-07T17:35:16.328721726Z",
"DHCPACK on 192.168.1.25 to 52:54:00:06:05:00 via br0"
]
]
}
]
}
]
}
That’s already a good step forwards, as the output is much smaller, because it reflects only the SYSLOG messages generated by the proper app. Now we need to narrow down the output only to the DHCPACK messages. To do that, we need somehow to add second condition to the filter, which contains the regex. We do it as follows:
2
3
4
5
6
7
8
9
10
11
12
13
14
15
16
17
18
19
20
21
22
23
24
25
26
27
28
29
30
31
32
33
34
35
36
37
38
39
40
41
42
43
44
45
46
47
48
49
50
51
52
53
54
55
56
57
58
59
60
61
62
63
64
65
66
67
{
"results": [
{
"statement_id": 0,
"series": [
{
"name": "syslog",
"columns": [
"time",
"message"
],
"values": [
[
"2019-06-07T17:34:40.815935002Z",
"DHCPACK on 192.168.1.22 to 52:54:00:06:02:00 via br0"
],
[
"2019-06-07T17:34:43.72010239Z",
"DHCPACK on 192.168.1.21 to 52:54:00:06:01:00 via br0"
],
[
"2019-06-07T17:34:49.840766732Z",
"DHCPACK on 192.168.1.24 to 52:54:00:06:04:00 via br0"
],
[
"2019-06-07T17:34:49.91179458Z",
"DHCPACK on 192.168.1.23 to 52:54:00:06:03:00 via br0"
],
[
"2019-06-07T17:34:55.361334303Z",
"DHCPACK on 192.168.1.26 to 52:54:00:06:06:00 via br0"
],
[
"2019-06-07T17:34:56.580548344Z",
"DHCPACK on 192.168.1.25 to 52:54:00:06:05:00 via br0"
],
[
"2019-06-07T17:35:08.937482651Z",
"DHCPACK on 192.168.1.22 to 52:54:00:06:02:00 via br0"
],
[
"2019-06-07T17:35:09.460017597Z",
"DHCPACK on 192.168.1.21 to 52:54:00:06:01:00 via br0"
],
[
"2019-06-07T17:35:12.278945889Z",
"DHCPACK on 192.168.1.23 to 52:54:00:06:03:00 via br0"
],
[
"2019-06-07T17:35:13.132821794Z",
"DHCPACK on 192.168.1.24 to 52:54:00:06:04:00 via br0"
],
[
"2019-06-07T17:35:15.302100335Z",
"DHCPACK on 192.168.1.26 to 52:54:00:06:06:00 via br0"
],
[
"2019-06-07T17:35:16.328721726Z",
"DHCPACK on 192.168.1.25 to 52:54:00:06:05:00 via br0"
]
]
}
]
}
]
}
Astonishing! Using regex for filtering the specific fields, we can fulfil the most sophisticated search requests and, therefore, build an outstanding automation solution.
Once we know, how the filter of the information in the InfluxDB looks like, we proceed with the TICK script itself.
The basic explanation about the TICK script you can find on the official website.
We will use, as mentioned earlier, the stream processing, meaning we should familiarize ourselves with the StreamNode.
Without going around, let’s nail down the point:
2
3
4
5
6
7
8
9
10
11
12
13
14
dbrp "dcf_syslog"."autogen"
stream
|from()
.database('dcf_syslog')
.retentionPolicy('autogen')
.measurement('syslog')
.where(lambda: "msgid" == 'dcf_dhcp')
.where(lambda: "message" =~ /^DHCPACK.*/)
|log()
|alert()
.crit(lambda: "message" =~ /^DHCPACK.*/)
.exec('/tmp/exec/launcher.sh')
Don’t feel yourself lost with the script above. I felt myself so during its creation, but now it’s much better. Here we go:
- Initially we say which database to look for and which retention policy to use in dbrp “dcf_syslog”.”autogen” statement. It’s mandatory for the TICK script and would be equal to ‘https://localhost:8086/query?db=dcf_snmp&rp=autogen‘ if we have used query, but we don’t use query! It’s just for an analogy.
- Then we instruct to use stream node.
- Its output is chained to the FromNode. The FromNode is the split in the several chunks our search filter “q=SELECT message FROM dcf_syslog.autogen.syslog WHERE (msgid = ‘dcf_dhcp’ AND message =~ /^DHCPACK/)”. Pay attention that values are provided in single-quote brackets, e.g. ‘dcf_syslog’ or ‘dcf_dhcp’, whereas the keys are framed in double-quote brackets, e.g. “msgid” and “message”. As you see, the .where method use the lambda expressions.
- The output of the FromNode is chained to the LogNode, which makes corresponding log entry to track that action has happed and that filter is correct. I mainly use it for debug purpose.
- In its turn the LogNode is chained to AlertNode. The AlerNode has two methods: the .crit method sets the condition (successful regex match, whereas the .exec mode launches the Bash script. Both methods are important, as the .exec won’t launch the automatic action if there is no .crit (or any other method with condition).
We will talk about the Bash script in a couple of minutes, cause it is “just” an execution. The real-time analytics, taking the decision to start action and to trigger it happens here.
When you have created the script, there are a couple of steps more, which you need to do, before it would be utilized.
The first such step is to register it. There are two options available: either copy it as file to the Docker container and call it locally or to transmit it using HTTP API. We will show here the first option. The folder data/scripts/ was mapped to a folder /home/kapacitor/scripts within container:
2
3
4
5
6
7
8
9
10
11
12
13
14
15
[sudo] password for aaa:
dbrp "dcf_syslog"."autogen"
stream
|from()
.database('dcf_syslog')
.retentionPolicy('autogen')
.measurement('syslog')
.where(lambda: "msgid" == 'dcf_dhcp')
.where(lambda: "message" =~ /^DHCPACK.*/)
|log()
|alert()
.crit(lambda: "message" =~ /^DHCPACK.*/)
.exec('/tmp/exec/launcher.sh')
The second option is implemented in the playbooks of the Data Centre Fabric, so you can refer there.
If the TICK script is inside the Docker container with Kapacitor, we can register it and verify it’s registered properly:
2
3
4
$ sudo docker container exec -it dcf_kapacitor kapacitor -url https://localhost:9092 -skipVerify list tasks
ID Type Status Executing Databases and Retention Policies
dhcp_syslog_registration stream disabled false ["dcf_syslog"."autogen"]
Though the task is defined, it is disabled and isn’t executed. That’s why the next step, after you define it, is to enable it and verify it’s enabled:
2
3
4
$ sudo docker container exec -it dcf_kapacitor kapacitor -url https://localhost:9092 -skipVerify list tasks
ID Type Status Executing Databases and Retention Policies
dhcp_syslog_registration stream enabled true ["dcf_syslog"."autogen"]
You can see that the task is now enabled and is being executed. We also can see the details of the task execution as well as some counters:
2
3
4
5
6
7
8
9
10
11
12
13
14
15
16
17
18
19
20
21
22
23
24
25
26
27
28
29
30
31
32
33
34
35
36
37
38
39
40
41
ID: dhcp_syslog_registration
Error:
Template:
Type: stream
Status: enabled
Executing: true
Created: 07 Jun 19 18:50 UTC
Modified: 07 Jun 19 19:01 UTC
LastEnabled: 07 Jun 19 19:01 UTC
Databases Retention Policies: ["dcf_syslog"."autogen"]
TICKscript:
dbrp "dcf_syslog"."autogen"
stream
|from()
.database('dcf_syslog')
.retentionPolicy('autogen')
.measurement('syslog')
.where(lambda: "msgid" == 'dcf_dhcp')
.where(lambda: "message" =~ /^DHCPACK.*/)
|log()
|alert()
.crit(lambda: "message" =~ /^DHCPACK.*/)
.exec('/tmp/exec/launcher.sh')
DOT:
digraph dhcp_syslog_registration {
graph [throughput="0.00 points/s"];
stream0 [avg_exec_time_ns="0s" errors="0" working_cardinality="0" ];
stream0 -> from1 [processed="222"];
from1 [avg_exec_time_ns="2.713µs" errors="0" working_cardinality="0" ];
from1 -> log2 [processed="46"];
log2 [avg_exec_time_ns="43.005µs" errors="0" working_cardinality="0" ];
log2 -> alert3 [processed="46"];
alert3 [alerts_inhibited="0" alerts_triggered="46" avg_exec_time_ns="1.259529ms" crits_triggered="46" errors="0" infos_triggered="0" oks_triggered="0" warns_triggered="0" working_cardinality="1" ];
}
You can see that 46 messages are processed, meaning there where in total 46 DHCPACK during the time I was writing the post. I restart one leaf:
2
3
4
5
6
7
[sudo] password for cumulus:
[ 2261.071172] reboot: Restarting system
Debian GNU/Linux 8 de-bln-leaf-111 ttyS0
de-bln-leaf-111 login:
Once it’s booted back and requests the IP address from the DCHP, we see the log in the Kapacitor logs:
It means that the TICK scripts works correctly. In other words, the closed loop automation works! Hurray!
The last step in this development cycle is to create the proper Bash script for this automated action.
#5. Connecting the TICK action with Ansible playbooks
Accodring to the algorithm logic, the Bash script should extract the value of the IP address and launch the Ansible playbook for provisioning of the dc_underlay for this particular IP address. The Bash script looks like as follows:
2
3
4
5
6
7
8
9
10
11
12
13
14
15
16
17
18
19
20
21
22
23
24
25
26
#!/bin/bash
# Extracting the management IPv4 of the node
cat | sed 's/.*DHCPACK on \([[:digit:]\.]\+\?\) to.*/\1/' > /tmp/exec/ip.conf
sleep 60
# Setting variables
IP=$(cat /tmp/exec/ip.conf)
TIME_DATE=$(date --iso-8601=seconds)
KAPACITOR_HOST=$(hostname)
# Creating Ansible variable for a specific host
echo "{"look_for_this_ip": "$IP"}" > /tmp/exec/specific_host.json
# Logging the start of the provisioning
ssh -o "StrictHostKeyChecking=no" aaa@sand9.karneliuk.com "mkdir /home/aaa/github/data_center_fabric/ansible/logs; echo '$TIME_DATE: $KAPACITOR_HOST started the provisioning for $IP' >> /home/aaa/github/data_center_fabric/ansible/logs/auto_deployment_by_kapacitor.log "
# Connecting to the host with Ansible and trigerring the action
ssh -o "StrictHostKeyChecking=no" aaa@sand9.karneliuk.com "cd /home/aaa/github/data_center_fabric/ansible ; ansible-playbook data_center_fabric.yml --inventory=inventory/hosts --tags=configure_underlay --extra-vars "look_for_this_ip=$IP""
TIME_DATE=$(date --iso-8601=seconds)
# Logging the finish of the provisioning
ssh -o "StrictHostKeyChecking=no" aaa@sand9.karneliuk.com "mkdir /home/aaa/github/data_center_fabric/ansible/logs; echo '$TIME_DATE: $KAPACITOR_HOST finished the provisioning for $IP' >> /home/aaa/github/data_center_fabric/ansible/logs/auto_deployment_by_kapacitor.log "
The folder with script is mapped to /tmp/exec within the Docker container.
We do there the following actions:
- The value of the SYSLOG messages comes from the TICK script as STDIN, hence initially we parse it to find an IP address and store it temporary to the file called /tmp/exec/ip.conf.
- Then for 60 seconds we do nothing to let the ZTP process to finalize.
- Afterwards the Bash script reads the value of the IP address from the file and set it as variable together with some other variables.
- Then it creates the JSON file with variable. Actually, this step isn’t necessary, and I have used it for the debugging purposes.
- Three ssh commands performs the logging to a file on the management host that the provisioning starts, then launch the Ansible playbook with proper tags and extra variable with IP address and logs that provisioning is finished.
The final step is to adapt the Ansible playbook we have deployed earlier so that it considers extra variable. We do it by adding the condition, that we launch the per-device execution if the IP address of the extra arg matches the management IPv4 address of the provisioned in the NetBox device or if such a variable doesn’t exist at all:
2
3
4
5
6
7
8
9
10
11
12
13
14
15
16
17
18
19
20
21
22
23
24
25
26
27
28
29
30
31
---
! OUTPUT IS OMITTED
- name: STARTING CONFIGURATION LOOP
include_tasks: status_check.yml
loop: "{{ get_devices.json.results }}"
loop_control:
loop_var: device_item
when: look_for_this_ip is undefined or (look_for_this_ip is defined and device_item.primary_ip4.address | ipaddr('address') == look_for_this_ip)
tags:
- configure_underlay
...
$ cat roles/dc_underlay/tasks/status_check.yml
---
- name: STATUS CHECK // VERIFYING THE DEVICE IS PROVISIONED
lineinfile:
path: /home/aaa/github/data_center_fabric/ansible/logs/auto_deployment_by_kapacitor.log
insertafter: EOF
line: "{{ ansible_date_time.iso8601 }}: ansible-playbook detects that {{ device_item.name }} having mgmt IP {{ device_item.primary_ip4.address | ipaddr('address') }} is not in the 'Planned' state"
when: device_item.status.label != 'Planned'
tags:
- configure_underlay
- name: STATUS CHECK // VERIFYING THE DEVICE ISN'T PROVISIONED
include_tasks: configuration_loop.yml
when: device_item.status.label == 'Planned'
tags:
- configure_underlay
...
The second part of the output is related to the fix of the false positive the case, when the DHCPACK generated (or logged) more than once. To avoid continuous re-provisioning of the network functions, we provision it only if the status of the Device in the NetBox is Planned. If it has any active status, it isn’t provisioned.
#6. Verification
All the preparatory work is done and we can test our closed-loop automation. Actually, we have an CLI-free data centre. All the initial configuration are done automatically, and, obviously we can extend such a logic as far as our imagination allow.
To finalize this test, we set in the NetBox all the switches to the planned states:

If everything was done previously correctly, we can start now our Data Center Fabric lab:
2
3
4
5
6
7
8
9
10
11
12
13
14
15
16
17
18
19
20
21
22
23
24
25
26
27
28
29
CREATING BRIDGES...
COPYING VMs...
CREATING VMs...
WARNING No operating system detected, VM performance may suffer. Specify an OS with --os-variant for optimal results.
Starting install...
Domain creation completed.
WARNING No operating system detected, VM performance may suffer. Specify an OS with --os-variant for optimal results.
Starting install...
Domain creation completed.
WARNING No operating system detected, VM performance may suffer. Specify an OS with --os-variant for optimal results.
Starting install...
Domain creation completed.
WARNING No operating system detected, VM performance may suffer. Specify an OS with --os-variant for optimal results.
Starting install...
Domain creation completed.
WARNING No operating system detected, VM performance may suffer. Specify an OS with --os-variant for optimal results.
Starting install...
Domain creation completed.
WARNING No operating system detected, VM performance may suffer. Specify an OS with --os-variant for optimal results.
Starting install...
Domain creation completed.
UPDATING IPTABLES...
Now we can relax for 5-10 minutes and create a coffee or tea. The data centre fabric switches are booted under the control of the Data Centre Fabric Enabler Stack. Time to time we can check the log file on the host with Ansible we’ve created to log the provisioning activities:
2
3
2019-06-07T19:58:10+00:00: 846320769d53 started the provisioning for 192.168.1.21
2019-06-07T19:58:14Z: ansible-playbook started configuration of de-bln-leaf-111 having mgmt IP 192.168.1.21
We see that our TICK script has found the respective DHCPACK message and based on our logic started the provisioning script.
That is the real-time analytics and associated closed-loop automation in action!
We need to wait until all the devices are provisioned:
2
3
4
5
6
7
8
9
10
11
12
13
14
15
16
17
18
19
20
2019-06-07T19:42:23+00:00: 9b58e18a6d53 finished the provisioning for 192.168.1.26
2019-06-07T19:58:10+00:00: 846320769d53 started the provisioning for 192.168.1.21
2019-06-07T19:58:14Z: ansible-playbook started configuration of de-bln-leaf-111 having mgmt IP 192.168.1.21
2019-06-07T19:58:44+00:00: 846320769d53 finished the provisioning for 192.168.1.21
2019-06-07T19:59:45+00:00: 846320769d53 started the provisioning for 192.168.1.22
2019-06-07T19:59:49Z: ansible-playbook started configuration of de-bln-leaf-112 having mgmt IP 192.168.1.22
2019-06-07T20:00:20+00:00: 846320769d53 finished the provisioning for 192.168.1.22
2019-06-07T20:01:20+00:00: 846320769d53 started the provisioning for 192.168.1.25
2019-06-07T20:01:25Z: ansible-playbook started configuration of de-bln-spine-101 having mgmt IP 192.168.1.25
2019-06-07T20:01:54+00:00: 846320769d53 finished the provisioning for 192.168.1.25
2019-06-07T20:02:54+00:00: 846320769d53 started the provisioning for 192.168.1.24
2019-06-07T20:02:58Z: ansible-playbook started configuration of de-bln-leaf-212 having mgmt IP 192.168.1.24
2019-06-07T20:03:28+00:00: 846320769d53 finished the provisioning for 192.168.1.24
2019-06-07T20:04:28+00:00: 846320769d53 started the provisioning for 192.168.1.23
2019-06-07T20:04:33Z: ansible-playbook started configuration of de-bln-leaf-211 having mgmt IP 192.168.1.23
2019-06-07T20:05:04+00:00: 846320769d53 finished the provisioning for 192.168.1.23
2019-06-07T20:06:04+00:00: 846320769d53 started the provisioning for 192.168.1.26
2019-06-07T20:06:09Z: ansible-playbook started configuration of de-bln-spine-201 having mgmt IP 192.168.1.26
2019-06-07T20:06:37+00:00: 846320769d53 finished the provisioning for 192.168.1.26
Then we can check if the devices are really provisioned. For instance, we can check the BGP summary and routing table:
2
3
4
5
6
7
8
9
10
11
12
13
14
15
16
17
18
19
20
21
22
23
24
25
26
27
28
29
30
31
32
33
34
35
36
37
38
39
40
41
42
43
44
45
46
47
48
49
50
51
52
53
54
55
56
57
58
59
60
61
62
63
64
65
66
67
68
69
70
71
72
73
74
75
76
77
78
79
80
81
82
83
84
85
86
87
88
show bgp ipv4 unicast summary
=============================
BGP router identifier 10.1.1.101, local AS number 65101 vrf-id 0
BGP table version 9
RIB entries 13, using 1976 bytes of memory
Peers 4, using 77 KiB of memory
Peer groups 2, using 128 bytes of memory
Neighbor V AS MsgRcvd MsgSent TblVer InQ OutQ Up/Down State/PfxRcd
de-bln-spine-101(169.254.0.0) 4 65000 48 52 0 0 0 00:06:37 4
de-bln-spine-201(169.254.0.2) 4 65000 20 24 0 0 0 00:01:53 4
Total number of neighbors 2
show bgp ipv6 unicast summary
=============================
BGP router identifier 10.1.1.101, local AS number 65101 vrf-id 0
BGP table version 1
RIB entries 1, using 152 bytes of memory
Peers 4, using 77 KiB of memory
Peer groups 2, using 128 bytes of memory
Neighbor V AS MsgRcvd MsgSent TblVer InQ OutQ Up/Down State/PfxRcd
fc00:de:1:: 4 65000 0 0 0 0 0 never Connect
fc00:de:1::2 4 65000 0 0 0 0 0 never Connect
Total number of neighbors 2
show bgp l2vpn evpn summary
===========================
BGP router identifier 10.1.1.101, local AS number 65101 vrf-id 0
BGP table version 0
RIB entries 0, using 0 bytes of memory
Peers 4, using 77 KiB of memory
Peer groups 2, using 128 bytes of memory
Neighbor V AS MsgRcvd MsgSent TblVer InQ OutQ Up/Down State/PfxRcd
de-bln-spine-101(169.254.0.0) 4 65000 48 52 0 0 0 00:06:37 0
de-bln-spine-201(169.254.0.2) 4 65000 20 24 0 0 0 00:01:53 0
Total number of neighbors 2
cumulus@de-bln-leaf-111:mgmt-vrf:~$ net show ro
rollback : revert to a previous configuration state
route : Static routes
route-map : Route-map
cumulus@de-bln-leaf-111:mgmt-vrf:~$ net show route
show ip route
=============
Codes: K - kernel route, C - connected, S - static, R - RIP,
O - OSPF, I - IS-IS, B - BGP, E - EIGRP, N - NHRP,
T - Table, v - VNC, V - VNC-Direct, A - Babel, D - SHARP,
F - PBR,
> - selected route, * - FIB route
B>* 10.1.1.1/32 [20/0] via 169.254.0.0, swp3, 00:06:46
B>* 10.1.1.2/32 [20/0] via 169.254.0.2, swp4, 00:02:03
C>* 10.1.1.101/32 is directly connected, lo, 00:10:00
B>* 10.1.1.102/32 [20/0] via 169.254.0.0, swp3, 00:02:03
* via 169.254.0.2, swp4, 00:02:03
B>* 10.1.1.104/32 [20/0] via 169.254.0.0, swp3, 00:02:02
* via 169.254.0.2, swp4, 00:02:02
B>* 10.1.1.105/32 [20/0] via 169.254.0.0, swp3, 00:02:03
* via 169.254.0.2, swp4, 00:02:03
C>* 169.254.0.0/31 is directly connected, swp3, 00:10:00
C>* 169.254.0.2/31 is directly connected, swp4, 00:10:00
show ipv6 route
===============
Codes: K - kernel route, C - connected, S - static, R - RIPng,
O - OSPFv3, I - IS-IS, B - BGP, N - NHRP, T - Table,
v - VNC, V - VNC-Direct, A - Babel, D - SHARP, F - PBR,
> - selected route, * - FIB route
C>* fc00:de:1::/127 is directly connected, swp3, 00:10:00
C>* fc00:de:1::2/127 is directly connected, swp4, 00:10:00
C>* fc00:de:1:1::101/128 is directly connected, lo, 00:10:00
C * fe80::/64 is directly connected, swp4, 00:10:00
C>* fe80::/64 is directly connected, swp3, 00:10:00
Finally, we check the status of the devices in the Digital Ocean NetBox:

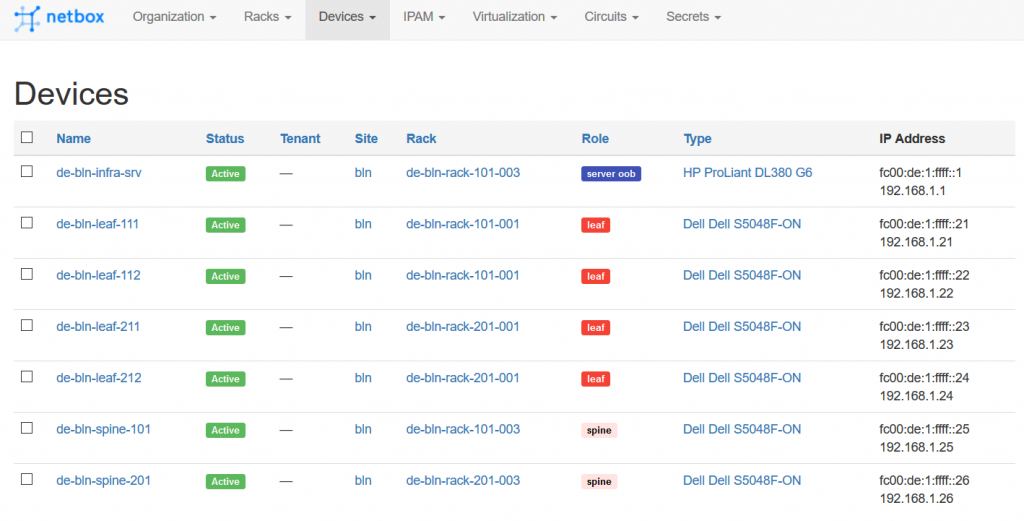
I hope that by now you can understand why I was so excited in the beginning of this article. It works. It just works.
Integrating the InfluxData Kapacitor app into our Data Centre Fabric Enabler stack
You know, my friend, I love automation. That’s why Kapacitor is integrated for auto provisioning and configuration into the Data Centre Fabric Enabler Stack, which consists currently out of nine applications:
- DHCP server
- DNS server
- HTTP server
- FTP Server
- InfluxDB
- Telegraf for SNMP
- Telegraf for SYSLOG
- Grafana Kapacitor
- And Ansible
And additionally (super important, but doesn’t launched as part of the DCFES):
- NetBox
From the Kapacitor integration prosecpctive we automate all the tasks we described in this article so far within the roles/cloud_enabler/tasks/container_dcf_kapacitor.yml file. Also, we update the roles/cloud_enabler/tasks/main.yml as follows:
2
3
4
5
6
7
8
9
10
11
12
13
14
15
16
17
18
19
20
!OUTPUT IS OMITTED
- name: BUILDING CONTAINERS ...
include_tasks: "container_{{ container_item }}.yml"
loop:
- dcf_influxdb
- dcf_telegraf_syslog
- dcf_telegraf_snmp
- dcf_grafana
- dcf_kapacitor
- dcf_dhcp
- dcf_dns
- dcf_ftp
- dcf_http
loop_control:
loop_var: container_item
tags:
- infra_enabler_install
- infra_enabler_ops
...
In addition, we create two templates:
- roles/cloud_enabler/templates/etc_hosts.j2 to create proper hostname/IP mapping for SSH keyless communication.
- roles/cloud_enabler/templates/launcher.j2 to fill in respective values into the Bash script.
And there is one more file, which is a static body of the request for the Kapacitor REST API to create the TICK script:
2
3
4
5
6
7
8
9
10
11
12
13
{
"id": "dhcp_ack_search",
"type": "stream",
"dbrps": [
{
"db": "dcf_syslog",
"rp": "autogen"
}
],
"script": "stream\n |from()\n .database('dcf_syslog')\n .retentionPolicy('autogen')\n .measurement('syslog')\n .where(lambda: "msgid" == 'dcf_dhcp')\n .where(lambda: "message" =~ /^DHCPACK.*/)\n |log()\n |alert()\n .crit(lambda: "message" =~ /^DHCPACK.*/)\n .exec('/tmp/exec/launcher.sh')",
"vars": {}
}
In the correspond playbook you would find the way, how this JSON body is used.
The topologies and initial configuration files you can find on my GitHub.

Lessons learned
Using the open source tools from the same vendor (InfluxDB) is quite convinent, as once you understand logic, it’s quite easily to use all of them. On the other hand, the TICK script language is a way more different comparing to traditional InfluxQL. Nevertheless, the development of the TICK scripts is very amazing process.
The second major lesson learned is about the integration. To deploy closed-loop automation you need to understand the communication flow between the applications. As you have seen, the tings such as a keyless SSH access are quite handy. The alternative would be to implement a possibility to listen for REST calls and to trigger the Ansible playbooks over it
Conclusion
The platform for closed-loop automation based on the real-time network analytics is created. Our Data Centre Fabric Enabler Stack deployed on a micro service architecture with Docker containers works well in the lab environment and could be easily scaled out when necessary. On this platform you can deploy any monitoring, analytic and closed-loop automation you need for your data centre. The last piece we miss still in our Data Centre Fabric project is the automated deployment of L2 and L3 services based on documentation on NetBox. Take care and good bye!
Support us
P.S.
If you have further questions or you need help with your networks, I’m happy to assist you, just send me message. Also don’t forget to share the article on your social media, if you like it.
BR,
Anton Karneliuk
One more promised TICK script
We mentioned a lot that TICK scripts could do a lot on the real-time or near-real-time analytics. Another topic we used TICK script for is the trend analysis or anomaly search. The scenario is the following:
- We take back in time three value of the SNMP counters showing the value of the sent octets. The values are taken back in history: one, two and three minutes ago.
- Using simple math we calculate two speeds: one and two minutes ago.
These steps are implemented in the script below:
2
3
4
5
6
7
8
9
10
11
12
13
14
15
16
17
18
19
20
21
22
23
24
25
26
27
28
29
30
31
32
33
34
35
36
37
38
39
40
41
42
43
44
45
46
47
48
49
50
51
52
53
54
55
56
57
58
59
60
dbrp "dcf_snmp"."autogen"
var utilization1 = batch
|query('''
SELECT ifHCOutOctets
FROM dcf_snmp.autogen.interfaceX
WHERE (hostname = 'de-bln-leaf-111' AND ifName = 'swp3')
''')
.align()
.period(15s)
.every(1m)
.offset(1m)
|last('ifHCOutOctets')
.as('ifHCOutOctets')
|log()
.prefix('AAAAAAAAAAAAAAAAAAAAAAA')
var utilization2 = batch
|query('''
SELECT ifHCOutOctets
FROM dcf_snmp.autogen.interfaceX
WHERE (hostname = 'de-bln-leaf-111' AND ifName = 'swp3')
''')
.align()
.period(15s)
.every(1m)
.offset(2m)
|last('ifHCOutOctets')
.as('ifHCOutOctets')
|log()
.prefix('BBBBBBBBBBBBBBBBBBBBBBB')
var utilization3 = batch
|query('''
SELECT ifHCOutOctets
FROM dcf_snmp.autogen.interfaceX
WHERE (hostname = 'de-bln-leaf-111' AND ifName = 'swp3')
''')
.align()
.period(15s)
.every(1m)
.offset(3m)
|last('ifHCOutOctets')
.as('ifHCOutOctets')
|log()
.prefix('CCCCCCCCCCCCCCCCCCCCCCC')
var total_util = utilization1
|join(utilization2, utilization3)
.as('utilization1', 'utilization2', 'utilization3')
.tolerance(3m)
|eval(lambda: ("utilization1.ifHCOutOctets" - "utilization2.ifHCOutOctets") * 8.00 / 600.00)
.as('current_speed')
|log()
.prefix('DDDDDDDDDDDDDDDDDDDDDDD')
|eval(lambda: ("utilization2.ifHCOutOctets" - "utilization3.ifHCOutOctets") * 8.00 / 600.00)
.as('previous_speed')
|log()
.prefix('EEEEEEEEEEEEEEEEEEEEEEE')
The further steps would be the following:
- Define which speed increase over one minute is considered as an anomaly: 10 percent, 20 percent or 100 percent.
- Based on the defined threshold we need to implement the comparison between two calculated speeds.
- In case threshold is crossed, some actions, like predefined set of infrastructure checks, are to be automatically triggered.
The further steps are still in the process of development.