

Hello my friend,
in the time when the business is conducted online, it is vital to have a clear visibility into the health of your services and their performance, especially if they rely on the media or other components outside of your immediate control. Earlier in our blogpost we have covered how and why to use iperf3 for measurements of a performance between your hosts and speediest to measure a performance of an Internet connectivity. Today we’ll show how to automate this process with the help of Prometheus.
2
3
4
5
retrieval system, or transmitted in any form or by any
means, electronic, mechanical or photocopying, recording,
or otherwise, for commercial purposes without the
prior permission of the author.
How Can We Automate Monitoring?
Automation is not only about Ansible and Python. Knowing how you can properly use various applications, especially those great open source tools available on the market is a key to your success. At the same time, Ansible plays a key role in rolling out application these days, as it helps to ensure that deployment is done in a consistent way. Ansible is like an extra pair of hands (or multiple extra pairs of hands) for you.
And we are delightful to teach you how to use it in an efficient way at our trainings!
We offer the following training programs:
- Zero-to-Hero Network Automation Training
- High-scale automation with Nornir
- Ansible Automation Orchestration with Ansble Tower / AWX
During these trainings you will learn the following topics:
- Success and failure strategies to build the automation tools.
- Principles of software developments and tools for that.
- Data encoding (free-text, XML, JSON, YAML, Protobuf)
- Model-driven network automation with YANG, NETCONF, RESTCONF, GNMI.
- Full configuration templating with Jinja2 based on the source of truth (NetBox).
- Best programming languages (Python, Bash) for developing automation, configuration management tools (Ansible) and automation frameworks (Nornir).
- Network automation infrastructure (Linux, Linux networking, KVM, Docker).
- Orchestration of automation workflows with AWX and its integration with NetBox, GitHub, as well as custom execution environments for better scalability.
Moreover, we put all mentions technologies in the context of real use cases, which our team has solved and are solving in various projects in the service providers, enterprise and data centre networks and systems across the Europe and USA. That gives you opportunity to ask questions to understand the solutions in-depts and have discussions about your own projects. And on top of that, each technology is provided with online demos and labs to master your skills thoroughly. Such a mixture creates a unique learning environment, which all students value so much. Join us and unleash your potential.
Brief Description
If we would simplify monitoring of any application or IT/Network infrastructure and describe it at a high level, we could summarise it with the following steps:
- Collection of interested metrics (e.g., passed octets over interface, CPU utilisation, number of performed transactions) with a desired frequency (e.g., each 10 seconds or 1 minute).
- Storing collected metrics in a time series databases, which is a specific type of data bases designed to store time series data.
- Visualising metrics with some tool, which takes input from time series data base.
- Implementing alerting over the time series data in case certain thresholds are crossed.
Earlier we have shared how to implement monitoring using Telegraf, InfluxDB and Grafana, which is one of two the most popular open source frameworks for data collection and monitoring:
- Telegraf and InfluxDB are open source tools from InfluxData.
- Granfana is a separate open source tool from Grafana Labs.
We already talked about InfluxDB and Telegraf: part 1 about SNMP and part 2 about Syslog.
Today we’ll take a look in another key open source framework for metrics collection (monitoring), which is called Prometheus. In fact, InfluxDB and Prometheus are the most widely used time series databases these days.
They have a few major differences (the comparison is by no mean complete and serving purpose to outline differences relevant from our use case perspective):
| Category | Prometheus | InfluxDB |
|---|---|---|
| Metic collection | Pull-mode – Prometheus connects to probe and actively pulls the data from it on a regular basis. | Push-mode – InfluxDB is listening for requests and writing data pushed by probes (e.g., Telegraf clients) |
| Metric types | Numbers – Prometheus stores only numerical data (e.g, counters, etc) | Numbers and strings – InfluxDB can store numbers (e.g., counters) as well as text strings (e.g., syslog messages) |
Therefore, ultimately the choice of tool is based on your network topology (can you expose your InfluxDB or can you expose Prometheus probes to be accessible) as well as type of the data you want to collect.
As our main focus for this blogpost is Prometheus, we’ll focus on it solely. It is easier to explain how it works not the example of particular use.
Use Case
Think about such a scenario.
You deploy a geo redundant application in a two 3rd party data centres. Your application require a stable communication channel between them, and you want to know for sure that the performance of such a channel is persistent. Also, your application serves customers in Internet and you are interested to check the uplink capacity in your data centre. Ultimately, you would like to do these tests on a regular basis and to see the results over the time and, as an addition, you may be interested in establishing automated alerting in case of performance doesn’t match the defined limit.
Solution Description
In the described scenario, we assume that there is a private connectivity between two data centres existing in one of the overlay VPN forms:
- SD-WAN
- BGP IP/MPLS VPN
If we have a private connectivity between our hosts, it would in general mean that you can deploy a pull model, where a host running Prometheus can connect to a probe, which collects metrics. The probe in Prometheus world is called an exporter and typical consist of two components:
- web server, which receives the instructions from Prometheus (i.e., configuration commands, such as targets, time intervals, metrics to collect, etc)
- probe, which actually performs measurements and collects metrics based on the instruction passed by web server and pass it back to the web server component.
To address the aforementioned scenario, we will deploy the following setup:

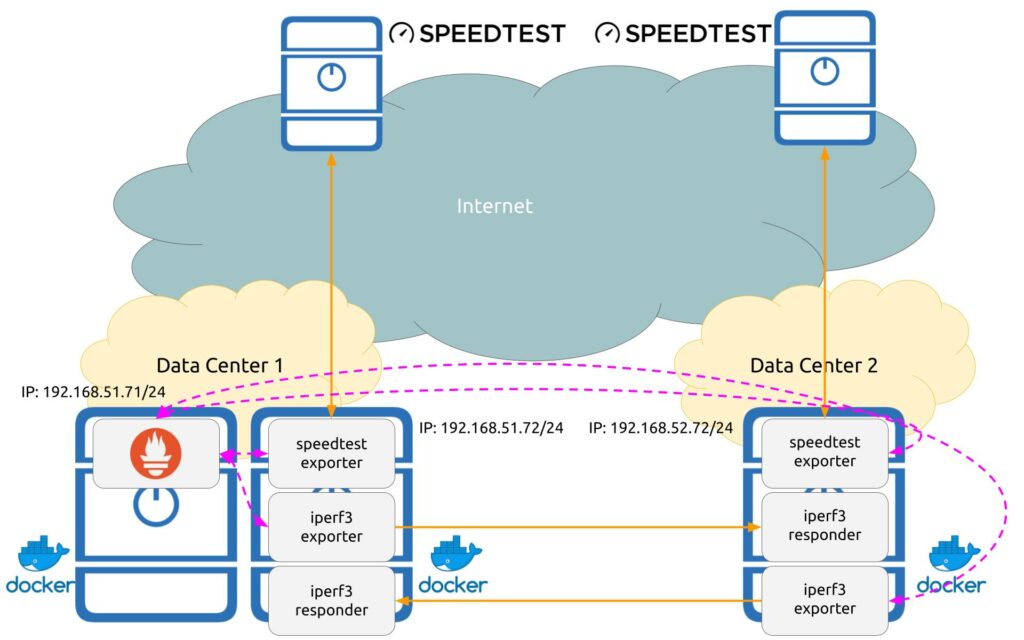
There are 3 hosts in this solution, which in our case VMs running Ubuntu Linux 20.04 LTS, but it can be any other operating system as long as you can have Docker installed and running.
Join our Zero-to-Hero Network Automation Training to master Linux and Docker administration skills.
The further setup is the following:
- First host with Docker in DC1:
- It runs a container with Prometheus. This container has a configuration file, which is used by Prometheus to which exporters to connect and which parameters pass it them.
- Second hosts with Docker in DC1:
- It runs a container with Speedtest exporter, which performs on a regular basis speedtest measurements based on the geo IP logic (standard speedtest functionality). Prometheus node interacts with this container.
- It runs a container with iperf3 exporter, which performa on a regular basis an iperf3 measurements against a host signalled by Prometheus. Prometheus node interacts with this container.
- It runs a container with iperf3 application launched in a server mode to respond to requests. Prometheus node DOES NOT interact with this container.
- Third host with Docker in DC2:
- This host has the same set of containers as the second one.
Looking on the image above, you could see also communication flows:
- Solid orange line represents data plane flows (measurement traffic between ipef3 probes or towards speedtest).
- Dashed violet line represents control plane flows (instructions from a Prometheus node to exporters and collected metrics).
We hope that both the setup and use cases are clear to you and now you are interested to see how it is deployed.
Implementation Details
It is assumed that you have freshly installed Ubuntu 20.04 LTS on your hosts.
Step #0. Install Docker
These days containers is a standard for packaging applications in Linux, as it gives flexibility and simplicity to manage necessary dependencies. As such, the first step is to have Docker installed:
2
3
4
5
$ curl -fsSL https://download.docker.com/linux/ubuntu/gpg | sudo gpg --dearmor -o /usr/share/keyrings/docker-archive-keyring.gpg
$ echo "deb [arch=$(dpkg --print-architecture) signed-by=/usr/share/keyrings/docker-archive-keyring.gpg] https://download.docker.com/linux/ubuntu $(lsb_release -cs) stable" | sudo tee /etc/apt/sources.list.d/docker.list > /dev/null
$ sudo apt-get update -y
$ sudo apt-get install docker-ce docker-ce-cli containerd.io -y
Once installed, check that Docker is working by launching a test container:
Consult for further details (e.g., other Linux distributives) with the official Docker documentation.
The final preparatory step is to have docker-compose tool installed, as it is easy and convenient way of managing multiple docker containers with a single command:
2
$ sudo chmod +x /usr/local/bin/docker-compose
Enrol to Zero-to-Hero Network Automation Training to master containers and Docker skills
Step #1. Hosts with Exporters
Good news is that there is already a number of open source tools available for us. We mean, that all three pieces of our probing setup (iperf3_exporter, iperf3_server, and speedtest_exporter) are already created. So, you need to create a directory at each host and create the following docker-compose.yaml file:
2
3
4
5
6
7
8
9
10
11
12
13
14
15
16
17
18
19
20
21
$ cd performance-monitoring
$ cat docker-compose.yaml
---
version: "3.9"
services:
iperf3_querier_exporter:
image: "edgard/iperf3-exporter:latest"
ports:
- "9579:9579"
iperf3_responder:
image: "networkstatic/iperf3"
ports:
- "5201:5201"
command:
- "-s"
speedtest:
image: "jraviles/prometheus_speedtest:latest"
ports:
- "9516:9516"
...
If for various reasons TCP ports 9579, 5201, 9516, are already used, you can modify them in this file and then to amend them in the Prometheus config.
Bring all the container up using docker-compose tool:
2
3
4
5
[sudo] password for aaa:
Starting performance-monitoring_speedtest_1 ... done
Starting performance-monitoring_iperf3_responder_1 ... done
Starting performance-monitoring_iperf3_querier_exporter_1 ... done
Check that containers with Prometheus exporters for iperf3 and speedtest as well as iperf3 server are up and running:
2
3
4
5
CONTAINER ID IMAGE COMMAND CREATED STATUS PORTS NAMES
7fa699d69c54 edgard/iperf3-exporter:latest "/bin/iperf3_exporter" 6 hours ago Up 3 hours 0.0.0.0:9579->9579/tcp, :::9579->9579/tcp performance-monitoring_iperf3_querier_exporter_1
8b68851bba03 jraviles/prometheus_speedtest:latest "python -m prometheu…" 6 hours ago Up 3 hours 0.0.0.0:9516->9516/tcp, :::9516->9516/tcp performance-monitoring_speedtest_1
96869a6c87a8 networkstatic/iperf3 "iperf3 -s" 6 hours ago Up 3 hours 0.0.0.0:5201->5201/tcp, :::5201->5201/tcp performance-monitoring_iperf3_responder_1
If all of them are up and running, then the probes’ side setup is ready and you can move to a step of prometheus setup itself.
Though it is not shown explicitly, both same config is applied on both monitoring hosts.
Step #2. Host with Prometheus
The setup of the host with Prometheus consists of two pieces:
- Configuration file with jobs descriptions.
- Docker-compose file with the setup of the Docker container.
Both of there are to be located in same directory, so create it:
2
$ cd prometheus
Let’s start with the first one.
Step #2.1. Prometheus Configuration File
First of all, create a directory for the config file and the config file itself:
2
3
4
5
6
7
8
9
10
11
12
13
14
15
16
17
18
19
20
21
22
23
24
25
26
27
28
29
30
31
32
33
34
35
36
37
38
39
40
41
42
43
44
45
46
47
48
49
$ cat config/prometheus.yaml
---
global:
scrape_interval: 5m
scrape_timeout: 2m
scrape_configs:
# iperf3 tests
- job_name: 'iperf3-probe-1'
metrics_path: /probe
static_configs:
- targets:
- 192.168.52.72
params:
port: ['5201']
relabel_configs:
- source_labels: [__address__]
target_label: __param_target
- source_labels: [__param_target]
target_label: instance
- target_label: __address__
replacement: 192.168.51.72:9579
- job_name: 'iperf3-probe-2'
metrics_path: /probe
static_configs:
- targets:
- 192.168.51.72
params:
port: ['5201']
relabel_configs:
- source_labels: [__address__]
target_label: __param_target
- source_labels: [__param_target]
target_label: instance
- target_label: __address__
replacement: 192.168.52.72:9579
# speedtest tests
- job_name: 'speedtest-probe-1'
metrics_path: /probe
static_configs:
- targets:
- 192.168.51.72:9516
- job_name: 'speedtest-probe-2'
metrics_path: /probe
static_configs:
- targets:
- 192.168.52.72:9516
...
Here we have a few parts to digest:
- global contains parameters shared across all the further jobs. In the provided case we provide two of them:
- scrape_interval, which is how often we do run tests
- scrape_timeout, which is how long do we wait at max to collect metrics after the start of measurement
- scrape_configs contains jobs describing each particular measurement we do. In the provided case it contains 4 jobs (one for each controlled container):
- Jobs iperf3-probe-1 and iperf3-probe-2 contain parameters needed for iperf3 test:
- static_configs/targets contain ip addresses of iperf3 servers, against which exporter will run its tests
- in relabel_configs you can find IP address and port on which the Prometheus node connects to iperf3 exporter.
- Jobs speedtest-probe-1 and speedtest-probe-2 contains parameters for speedtest. These jobs are simpler as they have only a single parameter static_configs/targets, which contains IP addresses of probes themselves.
- Jobs iperf3-probe-1 and iperf3-probe-2 contain parameters needed for iperf3 test:
Pay attention that static_configs/targets for iperf3_exporter and speedtest_exporter performs different tasks!
Step #2.2. Docker-compose File for Prometheus
Once the configuration file is ready, you can create the Docker container with Prometheus. However, before you do that, think about the following point.
By default, Docker containers don’t store any data persistently and, therefore, all data existing in them (e.g., collected metrics) are gone upon you tear down or restart the containers. To avoid this data loss, you need to create persistent storage with volumes, which would allow to store the important data. You may think, why should you want to reload containers? The answer is straightforward: the config file created in the previous step is read and processed upon the container launch. Therefore, in order to add new probes or measurements, you would need to restart the container with Prometheus. That’s why you need to take care of persistent storage for your data:
2
3
4
5
6
7
8
9
10
11
12
13
14
---
version: "3.9"
services:
prom:
image: "prom/prometheus"
ports:
- "9090:9090"
volumes:
- "./config:/etc/prometheus"
- "tsdb_persistent:/prometheus"
volumes:
tsdb_persistent:
...
Like in the previous case, the docker-compose file is used to create the service structure relying on an official Prometheus Docker image, the persistent volume you create and configuration file. You also need a port to connect to the Prometheus instance; therefore, we expose its default port 9090/TCP.
Once done, boot that up:
2
3
Creating network "prometheus_default" with the default driver
Creating volume "prometheus_tsdb_persistent" with default driver
And check it is working:
2
3
CONTAINER ID IMAGE COMMAND CREATED STATUS PORTS NAMES
cca15ce2189f prom/prometheus "/bin/prometheus --c…" 5 minutes ago Up 5 minutes 0.0.0.0:9090->9090/tcp, :::9090->9090/tcp prometheus_prom_1
Earlier in the configuration file we put the metrics collection interval as 5 minutes, so you can go for a brew until some metrics are collected.
Validation
Connect to your IP address and Prometheus port (in our case the IP address of host running Docker container with Prometheus is 192.168.51.71). Navigate to “Status -> Targets” tab:

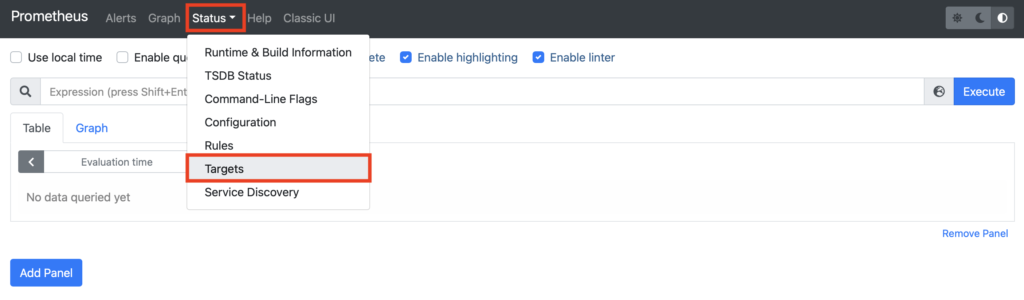
Once connected, if you have provided at least 5-10 minutes since the start of the container with Prometheus provided that all other steps were done correctly and there are no issues with connectivity towards exporters, you should see the following picture:

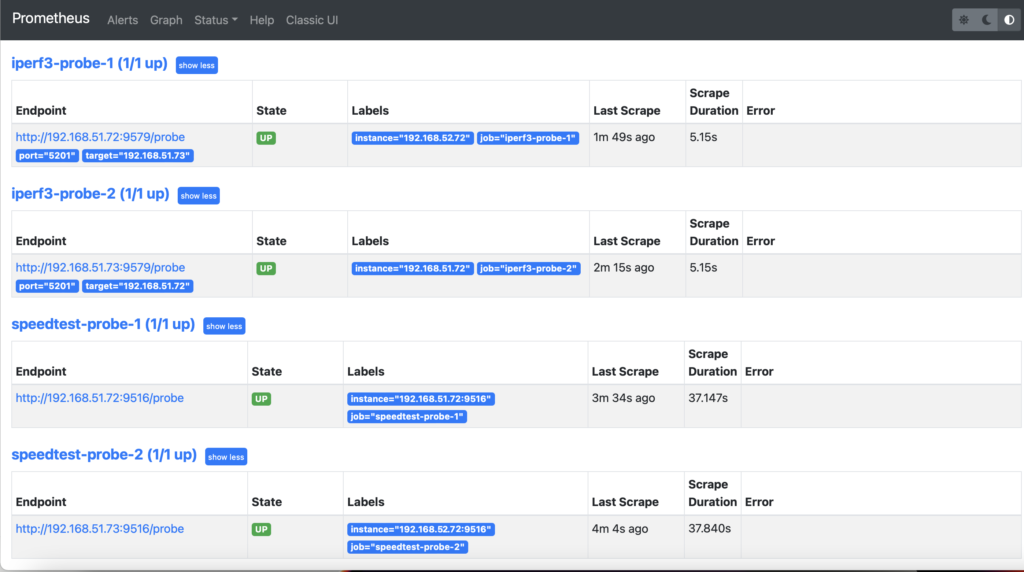
If status of all probes up, you can navigate to Graphs tab and choose Graphs data representation. In the query field type the name of the metric (for example, download_speed_bps or upload_speed_bps speedtest) and press Execute button:

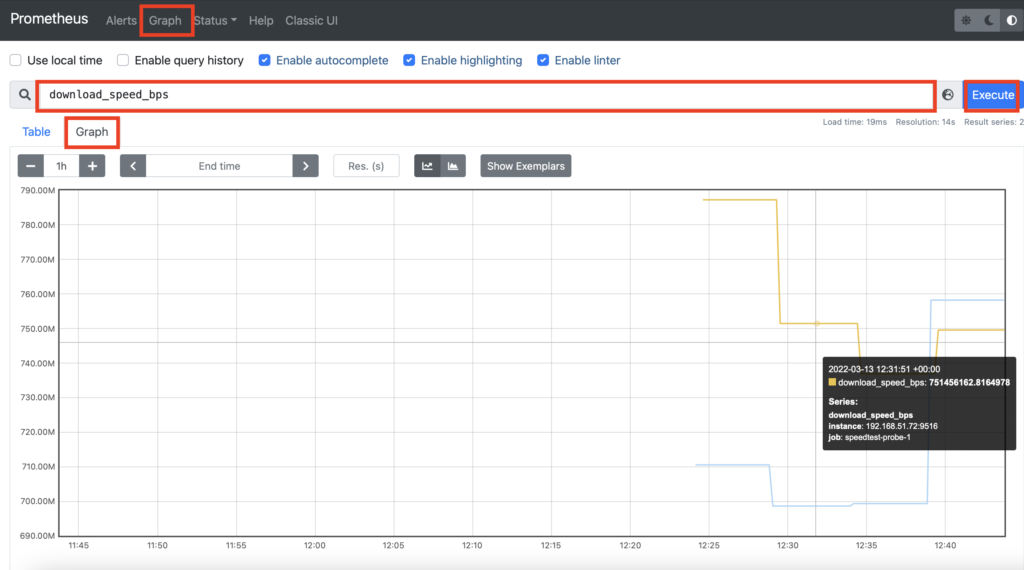
In the opened window you can see your collected metrics.
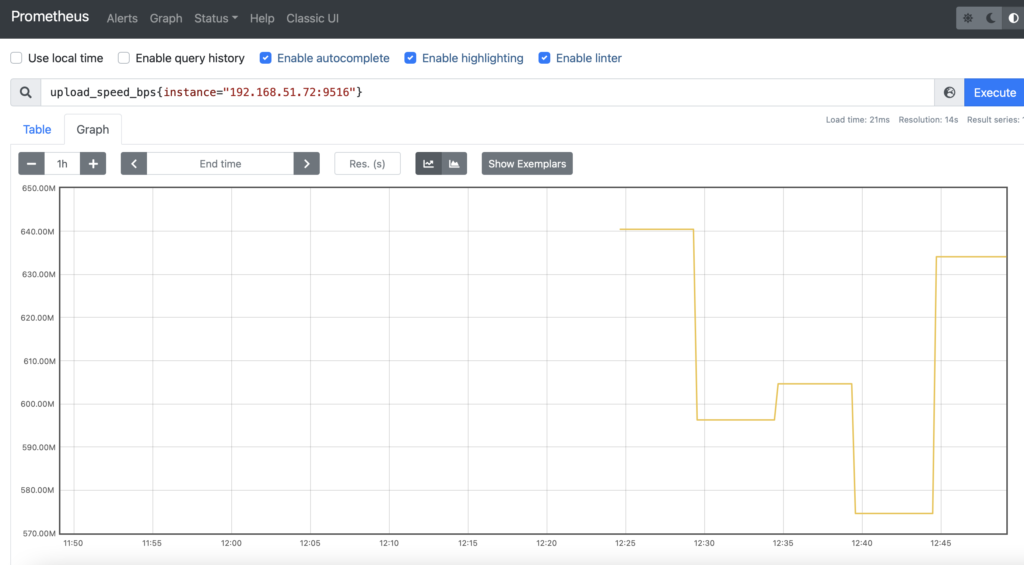
All metrics are shown, but you can filter some out if you need to. For example, you can specify to show metrics collected only from one of the instances.

Besides pure visualisation of metrics, it is possible to apply some math operations directly in Prometheus as well. For example, in order to show the bandwidth measured by iperf3, you need to take two metrics and apply some math operations:

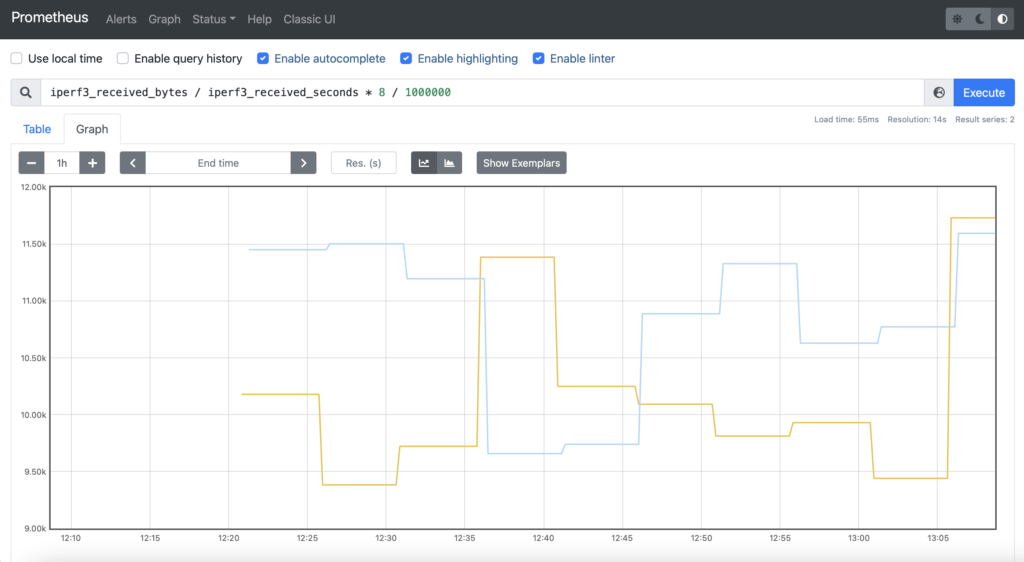
Happy monitoring!
Integration of Grafana and Prometheus would be a topic for a separate blogpost.
Examples in GitHub
You can find this and other examples in our GitHub repository.
Lessons Learned
We have built a lot of monitoring using InfluxDB and Telegraf before, but we haven’t used Prometheus beforehand. At a glance, one of the interesting benefits of Prometheus we have outlined for ourselves is the centralisation of a control plane on the Prometheus side. It makes the operational expenses to manage exporters really low, which is a very important factor in a high-scale environment.
Conclusion
Being one of the two most popular open source frameworks for monitoring these days, network engineers should know how to use Prometheus. We hope that provided examples help you to figure out how you can use it in your environment to improve observability of your IT and network infrastructure and, therefore, improve customer experience as well. Take care and good bye.
Need Help? Contract Us
If you need a trusted and experienced partner to automate your network and IT infrastructure, get in touch with us.
P.S.
If you have further questions or you need help with your networks, we are happy to assist you, just send us a message. Also don’t forget to share the article on your social media, if you like it.
BR,
Anton Karneliuk