


Hello my friend,
Monitoring is a key component of any IT and network systems, as it gives us possibility to know what is going on in those systems. That is important at least for two reasons:
- Observing actual status of the system counters
- Analyze trends over the time period
Let’s see how we can attempt to normalize collection of such a data with Prometheus from dis-aggregated network switches empowered by Linux.
2
3
4
5
retrieval system, or transmitted in any form or by any
means, electronic, mechanical or photocopying, recording,
or otherwise, for commercial purposes without the
prior permission of the author.
What Is the Relation Between Monitoring and Automation?
The answer would be “closed-loop automation” which is also often sold as IBN (Intent-Based Networking). It works as the collected data is automatically compared against certain patterns or thresholds and in case of threshold violation, some automated action can be triggered. It can be as simple as a notification via a mail, a Slack channel or a Telegram chat; however, it can be also a more complicated, where some automated workflow is triggered to perform corrective configuration activities.
And in our Network Automation Trainings you will learn how to build parametrized automation tools, which are ready to be triggered via external calls .
We offer the following training programs for you:
- Zero-to-Hero Network Automation Training
- High-scale automation with Nornir
- Ansible Automation Orchestration with Ansble Tower / AWX
- Expert-level training: Closed-loop Automation and Next-generation Monitoring
During these trainings you will learn the following topics:
- Success and failure strategies to build the automation tools.
- Principles of software developments and the most useful and convenient tools.
- Data encoding (free-text, XML, JSON, YAML, Protobuf).
- Model-driven network automation with YANG, NETCONF, RESTCONF, GNMI.
- Full configuration templating with Jinja2 based on the source of truth (NetBox).
- Best programming languages (Python, Bash) for developing automation
- The most rock-solid and functional tools for configuration management (Ansible) and Python-based automation frameworks (Nornir).
- Network automation infrastructure (Linux, Linux networking, KVM, Docker).
- Orchestration of automation workflows with AWX and its integration with NetBox, GitHub, as well as custom execution environments for better scalability.
- Collection network data via SNMP and streaming telemetry with Prometheus
- Building API gateways with Python leveraging Fast API
- Integration of alerting with Slack and your own APIs
- … and many more
Moreover, we put all mentions technologies in the context of real use cases, which our team has solved and are solving in various projects in the service providers, enterprise and data centre networks and systems across the Europe and USA. That gives you opportunity to ask questions to understand the solutions indepth and have discussions about your own projects. And on top of that, each technology is provided with online demos and labs to master your skills thoroughly. Such a mixture creates a unique learning environment, which all students value so much. Join us and unleash your potential.
Brief Description
Back in the past we already covered Prometheus setup and operation in a number of blogposts:
- Tools 8. Monitoring Network Performance with Dockerised Prometheus, Iperf3 and Speedtest
- Tools 9. Monitoring Availability of Customers via HTTP GET, ICMP, and DNS via Dockerised Prometheus
- Tools 10. Developing Our Own Cross-platform (AMD64/ARM32) Traceroute Prometheus Exporter for Network Monitoring using Python
Please, refer to those blogposts to learn the basic setup, configuration, and terminology
Today we’ll extend that series by covering one more type of exporter, which called Node Exporter, which we will run directly from data center switches.
Node exporter in Prometheus is one of the most basic exporters in Prometheus, which allows you to pull information about the Linux host. Its logic is fairly straightforward:
- You run the complied Go code on the Linux sever.
- That code, as many other exporters, contains a small web service which is polled by Prometheus.
- The data, which is being scraped by this exporter, is related to basic operating system metrics, such as:
- CPU utilization
- Memory utilization
- network IO
- Disk usage
- … and some more
As with other exporters, you define on the Prometheus side how often you want to scrape metrics: it can be each 60 seconds or even each second.
Beware of distribution and processing latency when you chose the interval for scraping. Also, pay attention to the CPU utilization of the network device in order not to overwhelm it by scrapping.
Running Prometheus node exporter is in general a trivial task on any Linux server. However, in our case we want to run it directly on data center switches. That is possible these days on dis-aggregated switches, which have Linux under the hood.
There may be some limitations, however, which you will learn during the course of the blogpost.
Why is that such an important topic? Is that important at all? We believe, it is.
From our experience, this is not uncommon to have different monitoring systems for servers and network devices. At the same time, absence of correlated data makes troubleshooting complicated. Having a single system with normalized data, such as Prometheus, simplifies such a troubleshooting, as all the data is available in one place in the same format.
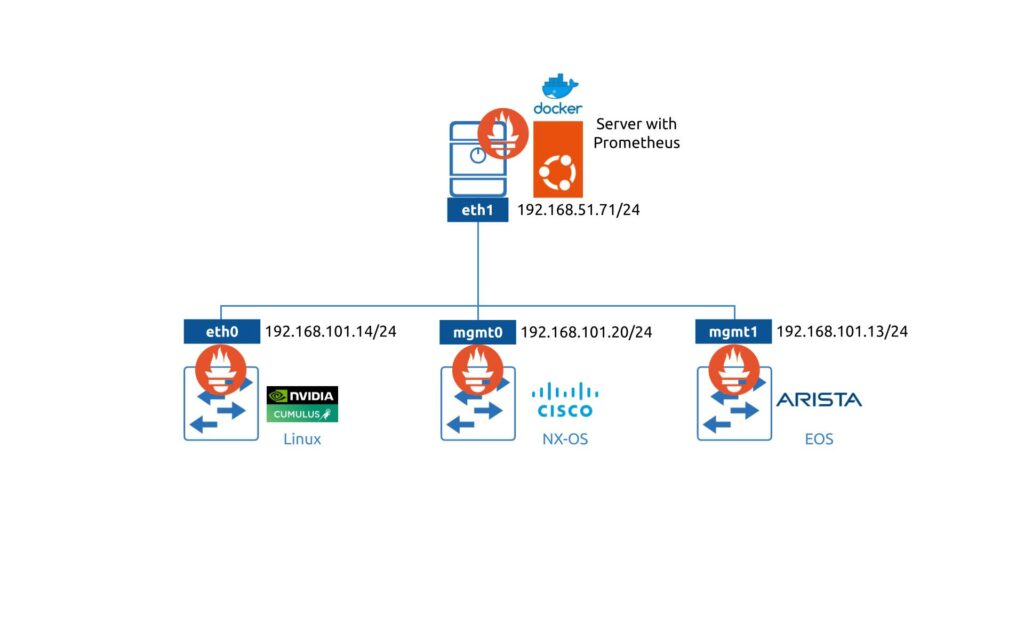
Scenario Description
In this lab we will install Prometheus Node Exporter on 3 different network operating systems running on data center switches:
- NVIDIA Cumulus Linux
- Cisco NX-OS
- Arista EOS
If you are vendor representative and are interested in your product to be covered as well, reach us out.
Lab Setup
To test such a solution, we will use the following lab setup:

Learn how to setup the Prometheus in the containerized environment with Docker.
Main components:
- Server with the monitoring backed runs Prometheus inside a Docker container on Ubuntu 20.04.
- NVIDIA Cumulus Linux is 4.4 (in fact, any Cumulus starting 3.7 would work, as I run Prometheus on Cumulus 3.7 and 5.1 in production).
- Arista EOSis 4.26.*
- Cisco NX-OS is 9.3.9
Enroll to Zero-to-Hero Network Automation Training to learn principles of containerization and practice skills of Docker management as well build your own containerized applications
Disclaimer
It is worth mentioning that we conduct the research and tests with virtual products:
- Cumulus VX for NVIDIA Cumulus Linux
- Arista vEOS 64-bit
- Cisco Nexus 9000v
When you plan to install extra applications on hardware switches, we strongly encourage you to conduct tests in the lab first. One of the reasons is the hardware dependencies (CPU and memory), which we cannot reproduce in lab. For example, if your switch is already running at 70% of CPU and memory utilization, installation of extra application may lead to a risk of outage.
Solution Implementation
1. NVIDIA Cumulus Linux
The first one on our list for building monitoring with Prometheus is NVIDIA Cumulus Linux. If you ask “Why?” the answer would be very simple: because it is just Debian on steroids. It doesn’t have any tight integrations and extra configuration contexts as Cisco NX-OS or Arista EOS. As such, it is easier to start with this network operating system.
Being a Debian Linux, Cumulus Linux has all the opportunities to install any extra packages, which you have in ordinary Debian. Obviously, beware of the resources’ (CPU/memory) consumption as explained above.
In general, the process of getting the Prometheus Node Exporter on any device running Linux consits from a few steps:
- Get the binary with the application.
- Create a service with that binary.
- Verify its operation locally (from the device itself) and remotely from some other host via the network connectivity.
We will stick to this approach for NVIDIA Cumulus Linux and for other network operating systems in this blgopost.
1.1. Download the Prometheus Node Expoter on NVIDIA Cumulus Linux
In our setup we use the management VRF. In the traditional network operating systems (Nokia SR OS, Cisco NX-OS, Arista EOS, etc) you would need to specify VRF if you do any activity (e.g., traceroute, ping or copy) relying on non-default routing table. So it is necesary in Linux. Depending on the setup, you would specify vrf using “ip vrf exec vrf_name xxx” or “ip netns exec vrf_name xxx” syntax, where vrf_name is name of VRF you rely on to do the activity and xxx is the command you want to execute.
So, first of all, get the names of your VRFs:
2
3
4
Name Table
-----------------------
mgmt 1001
Then, in order to download files over HTTP in any Linux, the command wget is one of the most widely used. So, putting it all togehter:
2
3
4
5
6
7
8
9
10
11
12
13
14
15
16
--2022-07-31 19:59:12-- https://github.com/prometheus/node_exporter/releases/download/v1.3.1/node_exporter-1.3.1.linux-amd64.tar.gz
Resolving github.com (github.com)... 140.82.121.3
Connecting to github.com (github.com)|140.82.121.3|:443... connected.
HTTP request sent, awaiting response... 302 Found
Location: https://objects.githubusercontent.com/github-production-release-asset-2e65be/9524057/7c60f6f9-7b41-446c-be81-a6c24a9d0383?X-Amz-Algorithm=AWS4-HMAC-SHA256&X-Amz-Credential=AKIAIWNJYAX4CSVEH53A%2F20220731%2Fus-east-1%2Fs3%2Faws4_request&X-Amz-Date=20220731T195856Z&X-Amz-Expires=300&X-Amz-Signature=ed3854e04f1a01336fc7714b0f278fb6ee77319c6d728093f7a7de0f4098e525&X-Amz-SignedHeaders=host&actor_id=0&key_id=0&repo_id=9524057&response-content-disposition=attachment%3B%20filename%3Dnode_exporter-1.3.1.linux-amd64.tar.gz&response-content-type=application%2Foctet-stream [following]
--2022-07-31 19:59:12-- https://objects.githubusercontent.com/github-production-release-asset-2e65be/9524057/7c60f6f9-7b41-446c-be81-a6c24a9d0383?X-Amz-Algorithm=AWS4-HMAC-SHA256&X-Amz-Credential=AKIAIWNJYAX4CSVEH53A%2F20220731%2Fus-east-1%2Fs3%2Faws4_request&X-Amz-Date=20220731T195856Z&X-Amz-Expires=300&X-Amz-Signature=ed3854e04f1a01336fc7714b0f278fb6ee77319c6d728093f7a7de0f4098e525&X-Amz-SignedHeaders=host&actor_id=0&key_id=0&repo_id=9524057&response-content-disposition=attachment%3B%20filename%3Dnode_exporter-1.3.1.linux-amd64.tar.gz&response-content-type=application%2Foctet-stream
Resolving objects.githubusercontent.com (objects.githubusercontent.com)... 185.199.109.133, 185.199.108.133, 185.199.110.133, ...
Connecting to objects.githubusercontent.com (objects.githubusercontent.com)|185.199.109.133|:443... connected.
HTTP request sent, awaiting response... 200 OK
Length: 9033415 (8.6M) [application/octet-stream]
Saving to: ‘node_exporter-1.3.1.linux-amd64.tar.gz’
node_exporter-1.3.1.linux-amd64.tar.gz 100%[====================================================================================>] 8.61M 7.61MB/s in 1.1s
2022-07-31 19:59:14 (7.61 MB/s) - ‘node_exporter-1.3.1.linux-amd64.tar.gz’ saved [9033415/9033415]
With this command you have downloaded the Prometheus Node Expoter to the Cumulus Linux leveraging mgmt VRF.
You can choose the needed version of node expoter in the official repo.
You have downloaded a tar archive, which is gzip-ed for compression. As such, you need to de-archive it before you can use the application:
2
3
4
5
cumulus@cumulus-vx:mgmt:~$ ls -l
total 8828
drwxr-xr-x 2 cumulus cumulus 4096 Dec 5 2021 node_exporter-1.3.1.linux-amd64
-rw-r--r-- 1 root root 9033415 Dec 8 2021 node_exporter-1.3.1.linux-amd64.tar.gz
Once you unpack it, you see in the directory a readme file, license, and the binary with the application itself:
2
3
4
5
total 17820
-rw-r--r-- 1 cumulus cumulus 11357 Dec 5 2021 LICENSE
-rwxr-xr-x 1 cumulus cumulus 18228926 Dec 5 2021 node_exporter
-rw-r--r-- 1 cumulus cumulus 463 Dec 5 2021 NOTICE
This file “node_expoter” is complied application, which can be directly executed without any further preparation from the perspective of your system. Now you need to create a sevice out of this file.
1.2. Create Linux Service for Prometheus Node Exporter in NVIDIA Cumulus Linux
In order to create a service, place the binary into the specific directory, where other applications live in Debian Linux:
Once that is acomplished, you need to create a service definition. In a nutshell, the service defition is a text file, which contains information how to launch the application, using which user/group, what is its sequence of launch relating other services and many more. Let’s create it:
2
3
4
5
6
7
8
9
10
11
12
13
[Unit]
Description=Node Exporter
Wants=network-online.target
After=network-online.target
[Service]
User=cumulus
ExecStart=/usr/local/bin/node_exporter
[Install]
WantedBy=default.target
EOF
For creation of service we use a tee editor, which simplifies management of text files.
Enroll to Zero-to-Hero Network Automation Training to master Linux administartion so that you can create solid foundation for your automations.
This file shall be placed in the directory /etc/systemd/system (we created it there directly), as that directory contains all other services definitions, whcih are active on your host.
The next step is to make the system aware that the new service is created. You can do that either by reboot of the switch, which is obviously an overkill, or by simply telling Linux that using the following command:
If there is no output after its execution, it means you did everything correct; otherwise you would see an error message telling what is wrong.
The final step is to enable the launch the service:
Again, there shall be no output. If that was the case, you can verify the status of the sevice:
2
3
4
5
6
7
8
9
10
11
12
13
14
15
16
17
18
19
● node_exporter.service - Node Exporter
Loaded: loaded (/etc/systemd/system/node_exporter.service; disabled; vendor preset: enabled)
Active: active (running) since Sun 2022-07-31 20:04:53 UTC; 4s ago
Main PID: 2249 (node_exporter)
Memory: 2.1M
CGroup: /system.slice/node_exporter.service
└─2249 /usr/local/bin/node_exporter
Jul 31 20:04:53 pod-013-vx1 node_exporter[2249]: ts=2022-07-31T20:04:53.408Z caller=node_exporter.go:115 level=info collector=thermal_zone
Jul 31 20:04:53 pod-013-vx1 node_exporter[2249]: ts=2022-07-31T20:04:53.408Z caller=node_exporter.go:115 level=info collector=time
Jul 31 20:04:53 pod-013-vx1 node_exporter[2249]: ts=2022-07-31T20:04:53.408Z caller=node_exporter.go:115 level=info collector=timex
Jul 31 20:04:53 pod-013-vx1 node_exporter[2249]: ts=2022-07-31T20:04:53.411Z caller=node_exporter.go:115 level=info collector=udp_queues
Jul 31 20:04:53 pod-013-vx1 node_exporter[2249]: ts=2022-07-31T20:04:53.411Z caller=node_exporter.go:115 level=info collector=uname
Jul 31 20:04:53 pod-013-vx1 node_exporter[2249]: ts=2022-07-31T20:04:53.411Z caller=node_exporter.go:115 level=info collector=vmstat
Jul 31 20:04:53 pod-013-vx1 node_exporter[2249]: ts=2022-07-31T20:04:53.411Z caller=node_exporter.go:115 level=info collector=xfs
Jul 31 20:04:53 pod-013-vx1 node_exporter[2249]: ts=2022-07-31T20:04:53.411Z caller=node_exporter.go:115 level=info collector=zfs
Jul 31 20:04:53 pod-013-vx1 node_exporter[2249]: ts=2022-07-31T20:04:53.411Z caller=node_exporter.go:199 level=info msg="Listening on" address=:9100
Jul 31 20:04:53 pod-013-vx1 node_exporter[2249]: ts=2022-07-31T20:04:53.413Z caller=tls_config.go:195 level=info msg="TLS is disabled." http2=false
It is worth mentioning that we don’t enable service for auto start. if you would desire to have it, run “sudo systemctl enable node_exporter.service” command,
1.3. Verify Operation of Prometheus Node Exporter in NVIDIA Cumulus Linux
When the configuration is done, it is the right time to see how the service is working (if it is working). Firt of all, in the snippet above you may see that the service is listening on the address “:9100”, which looks like a port without any IP specificed. Let’s check that assumption:
2
tcp LISTEN 0 128 *:9100 *:* users:(("node_exporter",pid=2249,fd=3))
Using this command you can see all the opened ports in your Linux. As there is quite a few opened, you would like to filter it only to the one(s) you are interested in, which in this case is 9100.
You indeed can see that port 9100/tcp is being listened on all the IP addresses. This is both good and bad:
- It is good, because we can connect to it.
- It is bad, becaue anyone can connect to it.
So, think about protecting it with ACLs.
The next step in validation is actually to query the service. To do so, you can use another Linux tool, which allows to make any HTTP request (in our case we need GET), which is called curl. Using this tool connect to the localhost and 9100 port and provide “metrics” keyword as a resource address:
2
3
4
5
6
7
8
9
10
11
12
13
14
15
16
17
18
19
20
21
# HELP go_gc_duration_seconds A summary of the pause duration of garbage collection cycles.
# TYPE go_gc_duration_seconds summary
go_gc_duration_seconds{quantile="0"} 0
go_gc_duration_seconds{quantile="0.25"} 0
go_gc_duration_seconds{quantile="0.5"} 0
go_gc_duration_seconds{quantile="0.75"} 0
go_gc_duration_seconds{quantile="1"} 0
go_gc_duration_seconds_sum 0
go_gc_duration_seconds_count 0
# HELP go_goroutines Number of goroutines that currently exist.
# TYPE go_goroutines gauge
go_goroutines 7
# HELP go_info Information about the Go environment.
# TYPE go_info gauge
go_info{version="go1.17.3"} 1
# HELP go_memstats_alloc_bytes Number of bytes allocated and still in use.
# TYPE go_memstats_alloc_bytes gauge
go_memstats_alloc_bytes 1.426936e+06
!
! FURTHER OUTPUT IS TRUNCATED FOR BREVITY
If you see tha output similar to one from the snippet above, then you have done everything correct and your Prometheus Node Expoter is up and running on NVIDIA Cumulus Linux.
The last step in the validation procedure is to query it from the remote host, which is in our case is the server with Prometheus:
2
3
4
5
6
7
8
9
10
11
12
13
14
15
16
17
18
19
20
21
22
23
24
# HELP go_gc_duration_seconds A summary of the pause duration of garbage collection cycles.
# TYPE go_gc_duration_seconds summary
go_gc_duration_seconds{quantile="0"} 0
go_gc_duration_seconds{quantile="0.25"} 0
go_gc_duration_seconds{quantile="0.5"} 0
go_gc_duration_seconds{quantile="0.75"} 0
go_gc_duration_seconds{quantile="1"} 0
go_gc_duration_seconds_sum 0
go_gc_duration_seconds_count 0
# HELP go_goroutines Number of goroutines that currently exist.
# TYPE go_goroutines gauge
go_goroutines 7
# HELP go_info Information about the Go environment.
# TYPE go_info gauge
go_info{version="go1.17.3"} 1
# HELP go_memstats_alloc_bytes Number of bytes allocated and still in use.
# TYPE go_memstats_alloc_bytes gauge
go_memstats_alloc_bytes 2.819976e+06
# HELP go_memstats_alloc_bytes_total Total number of bytes allocated, even if freed.
# TYPE go_memstats_alloc_bytes_total counter
go_memstats_alloc_bytes_total 2.819976e+06
!
! FURTHER OUTPUT IS TRUNCATED FOR BREVITY
Well done, my friend. You have successfuly completed setup for the first network operating system and is ready to move to the next one.
2. Cisco NX-OS
If NVIDIA Cumulus Linux is a native Linux, where we can install virtually any application supported by Debian distribution, in Cisco NX-OS the approach is very different. Despite Cisco NX-OS is a Linux based application, its integration is tighter than in NVIDIA Cumulus Linux. That leads to the fact that possibilities to install the 3rd party applications is generally less than in Cumulus. However, it still exists.
Cisco NX-OS has a concept of a guest shell, which is in fact a Linux container (LXC) running CentOS 7 (for Guest Shell version 2.*) or CentOS 8 (for Guest Shell 3.*), which you can run directly on the switch and which is yet has access to the underlying infrastructure. It is quite fascinating (at least it was for me) to see the content of routing tables as well as all the interfaces in a traditional Linux format from the Guest Shell environment.
2.1. Enable the Guest Shell in Cisco NX-OS
The Guest Shell functionality is available by default in Cisco Nexus 9000 or 3000; however, it is disabled. To enable it, run the following command:
It is taking a few minutes for it to be launched. You shall be checking it time to time using command “show virtual-service list” until you see it is activated:
2
3
4
5
6
7
Virtual Service List:
Name Status Package Name
-----------------------------------------------------------------------
guestshell+ Activated guestshell.ova
After you see it is activated, get into its configuration context:
2
[admin@guestshell ~]$
2.2. Download the Prometheus Node Exporter in Guest Shell at Ciscon NX-OS
As mentioned beforehand, Guest Shell in Cisco NX-OS is an LXC (Linux Container) running CentOS, which is in our case is CentOS 7. You can easily check it using standard Linux command for that:
2
3
4
5
6
7
8
9
10
11
12
13
14
15
16
17
18
NAME="CentOS Linux"
VERSION="7 (Core)"
ID="centos"
ID_LIKE="rhel fedora"
VERSION_ID="7"
PRETTY_NAME="CentOS Linux 7 (Core)"
ANSI_COLOR="0;31"
CPE_NAME="cpe:/o:centos:centos:7"
HOME_URL="https://www.centos.org/"
BUG_REPORT_URL="https://bugs.centos.org/"
CENTOS_MANTISBT_PROJECT="CentOS-7"
CENTOS_MANTISBT_PROJECT_VERSION="7"
REDHAT_SUPPORT_PRODUCT="centos"
REDHAT_SUPPORT_PRODUCT_VERSION="7"
CISCO_RELEASE_INFO=/etc/shared/os-release
That means that we are in Linux and all other Linux commands available for us. The first thing, we will check how we can check the Internet. The commands are similar to what we used before in NVIDIA Cumulus: we will use “ip netns exec vrf_name xxx” commands, where xxx is actually the action we need to do within the VRF. For example, we would like to check the presence of the default route. Per our setup, we are communicating with Cisco NX-OS via management VRF, so we need to honor that. IF we omit “ip netns exec vrf_name” part and will run simply “ip route show”, we will see the route table for the default VRF, which doesn’t have a default route:
2
[admin@guestshell ~]$
However, once we specify the VRF, the situation looks much better:
2
default via 192.168.101.1 dev eth1 proto static
That also mean, that we need to download the file from the Internet leveraging the management VRF:
Depending on your speed, it will take a moment or two. Once the file is downloaded, you need to de-archive it:
2
3
4
5
[admin@guestshell ~]$ ls -l
total 8825
drwxr-xr-x 2 admin network-admin 1024 Dec 5 2021 node_exporter-1.3.1.linux-amd64
-rw-r--r-- 1 root root 9033415 Jul 31 09:44 node_exporter-1.3.1.linux-amd64.tar.gz
In the created directory you will find a binary with node_expoter itself:
2
3
4
5
total 17818
-rw-r--r-- 1 admin network-admin 11357 Dec 5 2021 LICENSE
-rw-r--r-- 1 admin network-admin 463 Dec 5 2021 NOTICE
-rwxr-xr-x 1 admin network-admin 18228926 Dec 5 2021 node_exporter
2.3. Create a Service with Prometheus Node Exporter
The approach to create the service further is similar to one you have already seen for NVIDIA Cumulus Linux:
- You need to copy the binary in the corresponding directory
- You need to create a description of the service
- You need to enable and launch it
In CentOS 7, one of the main directories where all applications live is “/usr/local/bin/” directory. So, you should put the binary with Prometheus there:
Once this is done, you need to create a service definition:
2
3
4
5
6
7
8
9
10
11
12
13
14
[admin@guestshell ~]$ sudo tee /etc/systemd/system/node_exporter-management.service << EOF
[Unit]
Description=Node Exporter
After=network.target
[Service]
Type=simple
ExecStart=/sbin/ip netns exec management /usr/local/bin/node_exporter
[Install]
WantedBy=multi-user.target
EOF
```
The only real important value here is ExecStart: as you can see, we simply execute the binary WITHIN the management namespace (VRF). If you miss “ip netns exec management“, you will launch node_exporter in the default VRF and, therefore, won’t be able to connect it from the management VRF.
Once this is done, you need to reload the daemons to make sure that new service is added to the list. Once done, start it and check the status:
2
3
4
5
6
7
8
9
10
11
12
13
14
15
16
17
18
19
20
[admin@guestshell ~]$ sudo systemctl start node_exporter-management.service
[admin@guestshell ~]$ sudo systemctl status node_exporter-management.service
● node_exporter-management.service - Node Exporter
Loaded: loaded (/etc/systemd/system/node_exporter-management.service; disabled; vendor preset: disabled)
Active: active (running) since Sun 2022-07-31 10:21:05 UTC; 8h ago
Main PID: 531 (node_exporter)
CGroup: /system.slice/node_exporter-management.service
└─531 /usr/local/bin/node_exporter
Jul 31 10:21:06 guestshell ip[531]: ts=2022-07-31T10:21:06.013Z caller=node_exporter.go:115 level=info collector=thermal_zone
Jul 31 10:21:06 guestshell ip[531]: ts=2022-07-31T10:21:06.013Z caller=node_exporter.go:115 level=info collector=time
Jul 31 10:21:06 guestshell ip[531]: ts=2022-07-31T10:21:06.013Z caller=node_exporter.go:115 level=info collector=timex
Jul 31 10:21:06 guestshell ip[531]: ts=2022-07-31T10:21:06.013Z caller=node_exporter.go:115 level=info collector=udp_queues
Jul 31 10:21:06 guestshell ip[531]: ts=2022-07-31T10:21:06.013Z caller=node_exporter.go:115 level=info collector=uname
Jul 31 10:21:06 guestshell ip[531]: ts=2022-07-31T10:21:06.013Z caller=node_exporter.go:115 level=info collector=vmstat
Jul 31 10:21:06 guestshell ip[531]: ts=2022-07-31T10:21:06.013Z caller=node_exporter.go:115 level=info collector=xfs
Jul 31 10:21:06 guestshell ip[531]: ts=2022-07-31T10:21:06.013Z caller=node_exporter.go:115 level=info collector=zfs
Jul 31 10:21:06 guestshell ip[531]: ts=2022-07-31T10:21:06.013Z caller=node_exporter.go:199 level=info msg="Listening on" address=:9100
Jul 31 10:21:06 guestshell ip[531]: ts=2022-07-31T10:21:06.014Z caller=tls_config.go:195 level=info msg="TLS is disabled." http2=false
If you service in the “active (running)” state, it means you have done everything correct so far.
2.4. Verify Operation of Prometheus on Cisco NX-OS
First of all, check that the port is being listened within your guest shell:
2
tcp LISTEN 0 128 [::]:9100 [::]:* users:(("node_exporter",pid=531,fd=3))
Don’t forget to specify the namespace/VRF; otherwise you won’t see the port being listened.
Then, if you see the port open, you can run a simple test using curl directly from within the Guest Shell (yet again, don’t forget to mention the namespace):
2
3
4
5
6
7
8
9
10
11
12
13
14
15
16
17
18
19
20
21
22
23
24
25
26
27
# HELP go_gc_duration_seconds A summary of the pause duration of garbage collection cycles.
# TYPE go_gc_duration_seconds summary
go_gc_duration_seconds{quantile="0"} 7.6719e-05
go_gc_duration_seconds{quantile="0.25"} 0.000550161
go_gc_duration_seconds{quantile="0.5"} 0.000661821
go_gc_duration_seconds{quantile="0.75"} 0.000815438
go_gc_duration_seconds{quantile="1"} 0.048183802
go_gc_duration_seconds_sum 0.234798563
go_gc_duration_seconds_count 251
# HELP go_goroutines Number of goroutines that currently exist.
# TYPE go_goroutines gauge
go_goroutines 7
# HELP go_info Information about the Go environment.
# TYPE go_info gauge
go_info{version="go1.17.3"} 1
# HELP go_memstats_alloc_bytes Number of bytes allocated and still in use.
# TYPE go_memstats_alloc_bytes gauge
go_memstats_alloc_bytes 706968
# HELP go_memstats_alloc_bytes_total Total number of bytes allocated, even if freed.
# TYPE go_memstats_alloc_bytes_total counter
go_memstats_alloc_bytes_total 5.14168e+06
# HELP go_memstats_buck_hash_sys_bytes Number of bytes used by the profiling bucket hash table.
# TYPE go_memstats_buck_hash_sys_bytes gauge
go_memstats_buck_hash_sys_bytes 1.447295e+06
!
! FURTHER OUTPUT IS TRUNCATED FOR BREVITY
You shall be able to see quite a long list of collected metrics.
The final step is to check the metrics being collected from the Prometheus host:
2
3
4
5
6
7
8
9
10
11
12
13
14
15
16
17
18
19
20
21
22
23
24
25
26
27
28
# HELP go_gc_duration_seconds A summary of the pause duration of garbage collection cycles.
# TYPE go_gc_duration_seconds summary
go_gc_duration_seconds{quantile="0"} 0.000161558
go_gc_duration_seconds{quantile="0.25"} 0.000161558
go_gc_duration_seconds{quantile="0.5"} 0.000161558
go_gc_duration_seconds{quantile="0.75"} 0.000161558
go_gc_duration_seconds{quantile="1"} 0.000161558
go_gc_duration_seconds_sum 0.000161558
go_gc_duration_seconds_count 1
# HELP go_goroutines Number of goroutines that currently exist.
# TYPE go_goroutines gauge
go_goroutines 7
# HELP go_info Information about the Go environment.
# TYPE go_info gauge
go_info{version="go1.17.3"} 1
# HELP go_memstats_alloc_bytes Number of bytes allocated and still in use.
# TYPE go_memstats_alloc_bytes gauge
go_memstats_alloc_bytes 1.276432e+06
# HELP go_memstats_alloc_bytes_total Total number of bytes allocated, even if freed.
# TYPE go_memstats_alloc_bytes_total counter
go_memstats_alloc_bytes_total 3.90516e+06
# HELP go_memstats_buck_hash_sys_bytes Number of bytes used by the profiling bucket hash table.
# TYPE go_memstats_buck_hash_sys_bytes gauge
go_memstats_buck_hash_sys_bytes 1.446679e+06
# HELP go_memstats_frees_total Total number of frees.
# TYPE go_memstats_frees_total counter
go_memstats_frees_total 32650
It is working.
2.5. Some Points to Consider
During our tests, we observed an interesting yet a bit not expected behavior: when we launch the prometheus within the management netns, it shows counters belonging only to this VRF, which is different to the way how it operates on Cumulus Linux. It is visible by the list of reported interfaces:
2
3
4
5
6
7
8
9
# TYPE node_network_receive_bytes_total counter
node_network_receive_bytes_total{device="eth1"} 9.949074e+06
node_network_receive_bytes_total{device="gre0"} 0
node_network_receive_bytes_total{device="gretap0"} 0
node_network_receive_bytes_total{device="ip6gre0"} 0
node_network_receive_bytes_total{device="ip6tnl0"} 0
node_network_receive_bytes_total{device="lo"} 136292
node_network_receive_bytes_total{device="tunl0"} 0
This list is inline with what we see in terms of interfaces associated within this VRF:
2
3
4
5
6
7
8
9
10
11
12
13
14
15
16
17
18
19
20
21
22
23
24
25
1: lo: <LOOPBACK,UP,LOWER_UP> mtu 65536 qdisc noqueue state UNKNOWN group default
link/loopback 00:00:00:00:00:00 brd 00:00:00:00:00:00
inet 127.0.0.1/8 scope host lo
valid_lft forever preferred_lft forever
inet6 ::1/128 scope host
valid_lft forever preferred_lft forever
2: tunl0@NONE: <NOARP> mtu 1480 qdisc noop state DOWN group default
link/ipip 0.0.0.0 brd 0.0.0.0
3: gre0@NONE: <NOARP> mtu 1476 qdisc noop state DOWN group default
link/gre 0.0.0.0 brd 0.0.0.0
4: gretap0@NONE: <BROADCAST,MULTICAST> mtu 1462 qdisc noop state DOWN group default qlen 1000
link/ether 00:00:00:00:00:00 brd ff:ff:ff:ff:ff:ff
5: ip6tnl0@NONE: <NOARP> mtu 1452 qdisc noop state DOWN group default
link/tunnel6 :: brd ::
6: ip6gre0@NONE: <NOARP> mtu 1448 qdisc noop state DOWN group default
link/gre6 00:00:00:00:00:00:00:00:00:00:00:00:00:00:00:00 brd 00:00:00:00:00:00:00:00:00:00:00:00:00:00:00:00
7: eth1: <BROADCAST,MULTICAST,PROMISC,UP,LOWER_UP> mtu 1500 qdisc pfifo_fast state UP group default qlen 1000
link/ether 6e:00:64:d5:a5:1e brd ff:ff:ff:ff:ff:ff
inet 192.168.101.30/24 brd 192.168.101.255 scope global eth1
valid_lft forever preferred_lft forever
inet6 fc00:192:168:101::30/64 scope global nodad
valid_lft forever preferred_lft forever
inet6 fe80::6c00:64ff:fed5:a51e/64 scope link nodad
valid_lft forever preferred_lft forever
At the same time, the list of interfaces within the default VRF is much longer:
2
3
4
5
6
7
8
9
10
11
12
13
14
15
16
17
18
19
20
21
1: lo: <LOOPBACK,UP,LOWER_UP> mtu 65536 qdisc noqueue state UNKNOWN group default
link/loopback 00:00:00:00:00:00 brd 00:00:00:00:00:00
inet 127.0.0.1/16 scope host lo
valid_lft forever preferred_lft forever
2: dummy0: <BROADCAST,NOARP> mtu 1500 qdisc noop state DOWN group default
link/ether 52:61:0b:c0:df:20 brd ff:ff:ff:ff:ff:ff
7: phyEth1-1: <BROADCAST,MULTICAST,PROMISC,UP,LOWER_UP> mtu 1500 qdisc pfifo_fast state UP group default qlen 1000
link/ether 3a:b8:d5:41:87:82 brd ff:ff:ff:ff:ff:ff
8: phyEth1-2: <BROADCAST,MULTICAST,PROMISC,UP,LOWER_UP> mtu 1500 qdisc pfifo_fast state UP group default qlen 1000
link/ether 2a:52:76:20:a2:21 brd ff:ff:ff:ff:ff:ff
9: phyEth1-3: <BROADCAST,MULTICAST,PROMISC,UP,LOWER_UP> mtu 1500 qdisc pfifo_fast state UP group default qlen 1000
link/ether 96:2c:be:38:fc:58 brd ff:ff:ff:ff:ff:ff
10: phyEth1-4: <BROADCAST,MULTICAST,PROMISC,UP,LOWER_UP> mtu 1500 qdisc pfifo_fast state UP group default qlen 1000
link/ether c2:6c:cb:11:68:cd brd ff:ff:ff:ff:ff:ff
11: tunl0@NONE: <NOARP> mtu 1480 qdisc noop state DOWN group default
link/ipip 0.0.0.0 brd 0.0.0.0
12: gre0@NONE: <NOARP> mtu 1476 qdisc noop state DOWN group default
link/gre 0.0.0.0 brd 0.0.0.0
!
! FURTHER OUTPUT IS TRUNCATED FOR BREVITY
As such, further testing and Prometheus configuration tweaking are needed to report interfaces from all the VRFs via service in management VRF.
3. Arista EOS
The third device in a row and the third one, where we can setup the Prometheus exporter on top of. The approach is very similar to the first two: Arista EOS has Linux under the hood; therefore, we are need to download Prometheus Node Exporter binary, put into the corresponding directory and then to create a service.
3.1 Download Prometheus Exporter to Arista EOS
Unlike Cisco NX-OS, you don’t need to create an LXC or create any other container. All you need is to go inside the Bash CLI:
2
3
4
5
Arista Networks EOS shell
[zthnat@arista-eos ~]$
Once you are done, download the Prometheus Node Exporter using the same approach. The only difference in this setup compared to the two previous, we don’t use management VRF; thus, you can omit “ip netns exec mgmt” entirely for all the commands:
2
3
4
5
6
7
8
HTTP request sent, awaiting response... 200 OK
Length: 9033415 (8.6M) [application/octet-stream]
Saving to: 'node_exporter-1.3.1.linux-amd64.tar.gz'
100%[=============================================================================================================================>] 9,033,415 8.00MB/s in 1.1s
2022-07-31 19:15:24 (8.00 MB/s) - 'node_exporter-1.3.1.linux-amd64.tar.gz' saved [9033415/9033415]
Following the same approach explained before for NVIDIA Cumulus Linux and Cisco NX-OS, unpack the downlodaed file:
2
3
4
5
[zthnat@arista-eos ~]$ ls -l
total 8824
drwxr-xr-x 2 zthnat eosadmin 100 Dec 5 2021 node_exporter-1.3.1.linux-amd64
-rw-r--r-- 1 zthnat eosadmin 9033415 Dec 8 2021 node_exporter-1.3.1.linux-amd64.tar.gz
And verify its content:
2
3
4
5
total 17820
-rw-r--r-- 1 zthnat eosadmin 11357 Dec 5 2021 LICENSE
-rw-r--r-- 1 zthnat eosadmin 463 Dec 5 2021 NOTICE
-rwxr-xr-x 1 zthnat eosadmin 18228926 Dec 5 2021 node_exporter
By this time you should already have figured out that we are using the same Prometheus node exporter for all our switches. However, if you have base different to x86_64 (e.g., arm32 or arm64 based), you may need to use a different Prometehus Node Exporter binary.
3.2. Create a Service with Prometheus Node Exporter at Arista EOS
Put the Prometheus Node Exporter application in the same directory you did for Cisco NX-OS:
And create the service afterwards. Remeber, however, that this time we create it in the default VRF rather than in the management one:
2
3
4
5
6
7
8
9
10
11
12
[Unit]
Description=Node Exporter
After=network.target
[Service]
Type=simple
ExecStart=/usr/local/bin/node_exporter
[Install]
WantedBy=multi-user.target
EOF
The aforementioned fact of launching the node exporter in the default VRF reflects itsels in the ExecStart key, where we specify only the path to the node exporter without the “ip netns exec vrf_name” part.
The next step is to launch the service re-reading the content of the directory with services beforehand:
2
3
4
5
6
7
8
9
[zthnat@arista-eos ~]$ sudo systemctl start node_exporter-management.service
[zthnat@arista-eos ~]$ sudo systemctl status node_exporter-management.service
* node_exporter-management.service - Node Exporter
Loaded: loaded (/etc/systemd/system/node_exporter-management.service; disabled; vendor preset: disabled)
Active: active (running) since Sun 2022-07-31 19:18:23 UTC; 4s ago
Main PID: 28589 (node_exporter)
CGroup: /system.slice/node_exporter-management.service
`-28589 /usr/local/bin/node_exporter
If you service is up and running, move to the next step.
3.3. Verification of Prometheus Node Exporter on Arista EOS
The validation steps are exactly the same as you have already seen two times:
- Check if the port is opened
- Validate the operation locally from the network funciton using curl.
- Validate the operation of the Prometheus Node Exporter remotely from the Prometheus server.
The first step is achieved using the same command as before:
2
tcp LISTEN 0 1024 *:9100 *:*
Once you validate that the port is being listened, you can check the operation of the service locally:
2
3
4
5
6
7
8
9
10
11
12
13
14
15
16
17
18
19
20
21
22
23
24
25
26
27
28
29
# HELP go_gc_duration_seconds A summary of the pause duration of garbage collection cycles.
# TYPE go_gc_duration_seconds summary
go_gc_duration_seconds{quantile="0"} 0
go_gc_duration_seconds{quantile="0.25"} 0
go_gc_duration_seconds{quantile="0.5"} 0
go_gc_duration_seconds{quantile="0.75"} 0
go_gc_duration_seconds{quantile="1"} 0
go_gc_duration_seconds_sum 0
go_gc_duration_seconds_count 0
# HELP go_goroutines Number of goroutines that currently exist.
# TYPE go_goroutines gauge
go_goroutines 7
# HELP go_info Information about the Go environment.
# TYPE go_info gauge
go_info{version="go1.17.3"} 1
# HELP go_memstats_alloc_bytes Number of bytes allocated and still in use.
# TYPE go_memstats_alloc_bytes gauge
go_memstats_alloc_bytes 1.426936e+06
# HELP go_memstats_alloc_bytes_total Total number of bytes allocated, even if freed.
# TYPE go_memstats_alloc_bytes_total counter
go_memstats_alloc_bytes_total 1.426936e+06
# HELP go_memstats_buck_hash_sys_bytes Number of bytes used by the profiling bucket hash table.
# TYPE go_memstats_buck_hash_sys_bytes gauge
go_memstats_buck_hash_sys_bytes 1.445975e+06
# HELP go_memstats_frees_total Total number of frees.
# TYPE go_memstats_frees_total counter
!
! FURTHER OUTPUT IS TRUNCATED FOR BREVITY
So far everything looked identical. However, now there is a bit of route de-tour. By default the port for the Prometheus node exporter (9100/tcp) is not opened in the iptables in Arista EOS. As such, if you don’t open it, you won’t be able to reach it. Therefore, you should open it:
Once this operation is completed, you can test the operation of Prometheus Node Exporter from the remote server:
2
3
4
5
6
7
8
9
10
11
12
13
14
15
16
17
18
19
20
21
# HELP go_gc_duration_seconds A summary of the pause duration of garbage collection cycles.
# TYPE go_gc_duration_seconds summary
go_gc_duration_seconds{quantile="0"} 0
go_gc_duration_seconds{quantile="0.25"} 0
go_gc_duration_seconds{quantile="0.5"} 0
go_gc_duration_seconds{quantile="0.75"} 0
go_gc_duration_seconds{quantile="1"} 0
go_gc_duration_seconds_sum 0
go_gc_duration_seconds_count 0
# HELP go_goroutines Number of goroutines that currently exist.
# TYPE go_goroutines gauge
go_goroutines 7
# HELP go_info Information about the Go environment.
# TYPE go_info gauge
go_info{version="go1.17.3"} 1
# HELP go_memstats_alloc_bytes Number of bytes allocated and still in use.
# TYPE go_memstats_alloc_bytes gauge
go_memstats_alloc_bytes 3.05076e+06
!
! FURTHER OUTPUT IS TRUNCATED FOR BREVITY
3/3 of our node exporters is completed.
Further considerations
You may think that deploing Prometheus Node Exporters on all the swtiches in your data centre, provided it is possible, is a silver bullet to all the monitoring problems. It is not, however. The functionality of the node exporter, as explained before, is focused on the stanadard infrastructure aspects:
- Reachability of the device
- Networking utilisation
- CPU and memory utlisation
- Disk space
As such, it doesn’t focus on the important networking metrics, such as amount of routes in your routing table, status of BGP peers, QoS counters in different queues, bytes forwarded along multicast tree, etc. To collect that information, you would need to rely on other technologies and frameworks, such as streaming telemetry. At the same time, it is possible to create your own custom exporters, which will be collecting the needed information in fashion similar to the node exporter: having an agent on the switch.
Lessons Learned
Using the guest shell in Cisco NX-OS was an interesting experience for us, which allowed to look on Cisco Nexus from a bit different angle. As mentioned before, it gives you access to many data sets in the same format as in traditional Linux with a possibility to use Linux tools including ones you will install extra.
In general, possibility to install applications we use for traditional troubleshooting, such as mtr, fping, etc on switches in addition to Python scripts improves possibility for network operations quite significantly in our eyes.
Summary
Building proper monitoring system is always a challenging task. Moreover, it is all about tradeoffs and a lot of testing. Having all base metrics collected in a single (redundant) Prometheus setup is a good step, which can allow you to correlate, for example, interaces utilization across both your servers’ and networks’ fleets. At the same time, you may need extra network metrics, which are not covered by the node expoters and, therefore, further design and development decision shall be taken. With out automation trainings you will be well equiped to make such decisions. Take care and good bye.
Need Help? Contract Us
If you need a trusted and experienced partner to automate your network and IT infrastructure, get in touch with us.
P.S.
If you have further questions or you need help with your networks, we are happy to assist you, just send us a message. Also don’t forget to share the article on your social media, if you like it.
BR,
Anton Karneliuk