

Dear friend,
Awareness of what is happening in your IT infrastructure (in our case, in network) is a key success or failure factor of any modern business, as huge majority of businesses are now running online. The awareness is built on top of visibility of network events and activities happening in the network, which in their turn reflects in data points, which can be collected. In this blogpost we’ll cover how these data points can be collected in multi vendor network running Cisco IOS XR, Nokia SR OS and Arista EOS switches using Prometheus, which is one of the most popular monitoring platforms these days.
2
3
4
5
retrieval system, or transmitted in any form or by any
means, electronic, mechanical or photocopying, recording,
or otherwise, for commercial purposes without the
prior permission of the author.
Is Monitoring Needed for Network Automation?
The ultimate state of any system, including the IT/network is self-managed (self-healed, self-controlled, etc). It is simply impossible to build any self-controlled system without monitoring and collection of the data, as this data collection in the self-controlled system is the only (as we remove people from the decision making) way how the system may know what is it is health and where it shall be moving towards. As such proper monitoring is a must of automation systems.
By the way, we have training programs, which teaches you how to build the next-generation monitoring for network automation and the network automation, of course, the network automation systems and solutions:
We offer the following training programs for you:
- Zero-to-Hero Network Automation Training
- High-scale automation with Nornir
- Ansible Automation Orchestration with Ansble Tower / AWX
- Expert-level training: Closed-loop Automation and Next-generation Monitoring
During these trainings you will learn the following topics:
- Success and failure strategies to build the automation tools.
- Principles of software developments and the most useful and convenient tools.
- Data encoding (free-text, XML, JSON, YAML, Protobuf).
- Model-driven network automation with YANG, NETCONF, RESTCONF, GNMI.
- Full configuration templating with Jinja2 based on the source of truth (NetBox).
- Best programming languages (Python, Bash) for developing automation
- The most rock-solid and functional tools for configuration management (Ansible) and Python-based automation frameworks (Nornir).
- Network automation infrastructure (Linux, Linux networking, KVM, Docker).
- Orchestration of automation workflows with AWX and its integration with NetBox, GitHub, as well as custom execution environments for better scalability.
- Collection network data via SNMP and streaming telemetry with Prometheus
- Building API gateways with Python leveraging Fast API
- Integration of alerting with Slack and your own APIs
- … and many more
We constantly update materials in our trainings for them to stay relevant not only for networks of today, but also in future. Therefore, we emphasize a lot model-driven automation framework, all its building blocks and components, so that you can get away from legacy CLI-based based scrapping and automation. Join us and unleash your potential.
Brief Description
We already discussed Prometheus in a few previous blogposts:
- Monitoring Network Performance with Dockerised Prometheus, Iperf3 and Speedtest
- Monitoring Availability of Customers via HTTP GET, ICMP, and DNS via Dockerised Prometheus
- Developing Our Own Cross-platform (AMD64/ARM32) Traceroute Prometheus Exporter for Network Monitoring using Python
- Running Prometheus Exporters on Dis-aggregated Data Center Switches (Cisco NX-OS, NVIDIA Cumulus Linux, Arista EOS)
Therefore, we will skip the part explaining why you would like to use Prometheus for Network Monitoring. Read the aforementioned blogposts to get that info.
SNMP has been the primary method to monitor network devices, together with syslog, for decades. Despite it has got a massive rival in the form of the streaming telemetry recently, it is still the leader, and will continue to be so for the time being until the ecosystem for the streaming telemetry, as well as the penetration level of its support across network devices will reach a minimum critical level to start the sky rocketing growth. Until that happens, and, probably, even when that happens, SNMP still will be used to collect the numerical data.
Let’s quickly brush up SNMP. It stands for Simple Network Management Protocol and is used to communicate basic network devices’ metrics, such as state of the interface, amount of sent/received packets/bytes, etc. It can work in two modes:
| Mode | Description |
|---|---|
| POLL | This is a mechanism to collect the data from network devices by network management system (NMS) at regular intervals (e.g., each 30 seconds). This method is primarily used to collect data for various graphs as well as to build up alerting |
| TRAP | This approach is used, when the data point shall be sent immediately by the network device to the NMS in case of certain network events (e.g., network interface went down) and, therefore, is primary used for alerting. |
Prometheus can implement for us the first mode, as it implements pull-mode for operation. Take a look at the following picture:

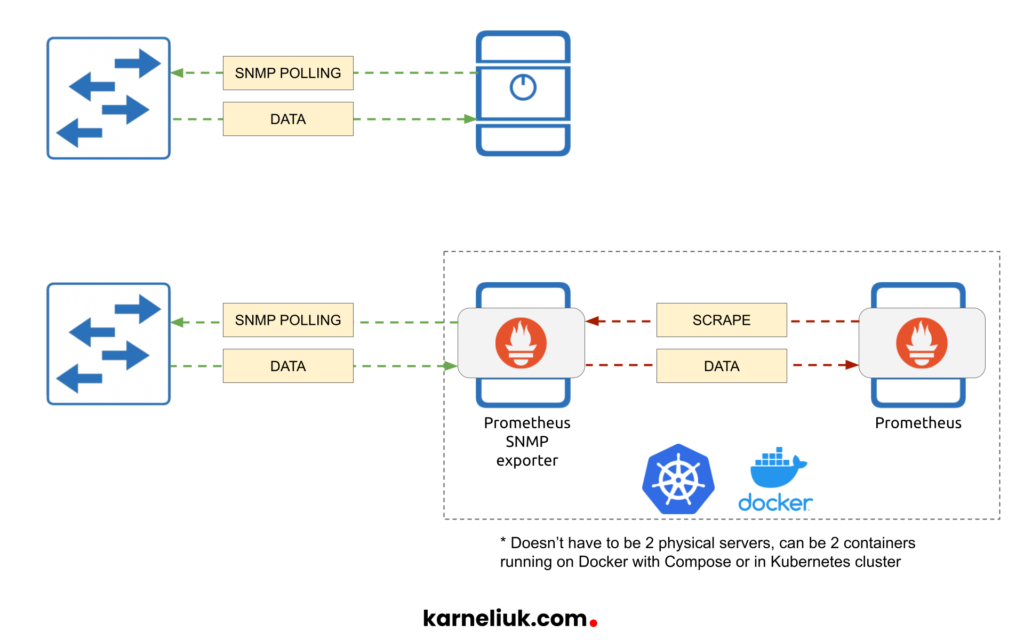
In case of SNMP polling, the NMS performs an operation to collect data using GET, GET-NEXT, or GET-BULK request type and receives response to its request. Prometheus deploys the same model with its exporters, which is called pull-mode: It performs the scrape request and receives some data back. As such, it becomes obvious that these two approaches are identical and, therefore, can nicely complement each other in the following way:
- Prometheus tells its exporter to collect certain data from network device via SNMP.
- The exporter performs SNMP polls operation and obtains the necessary data.
- The exporter responds to the Prometheus with the data from the request.
The key role here plays this specific exporter. As you may already know, exporter is an agent, which is being polled by the Prometheus central backend. Previously we have shown how to install the Node Exporter to collect the data from the disaggregated data center switches. What if, however, you are not that lucky and you run some traditional network operating system, such as Cisco IOS XR or Nokia SR OS, which are very popular in the Service Provider world. In such a scenario, you cannot install the node exporter on the network devices. That’s where the Prometheus SNMP exporter comes onto the stage.
The Prometheus SNMP exporter is an agent, which receives requests from Prometheus and responds to it using the messaging format supported by Prometheus. Locally on the exporter there is a configuration file, which contains information about MIBs, which needs to be polled, structured in the so-called “modules” as well as the credentials (i.e., SNMP community strings for SNMP v1 and v2 and username/passwords for SNMPv3). Upon request from the Prometheus, which includes the FQDN or IP address of the target device to be polled as well as the name of the module to use, SNMP exporter looks in its config to find the necessary OIDs and credentials and attempts to poll the device. If that operation is successful, SNMP exporter returns collected data.
Lab Setup
As we claimed in the title of this blogpost, we are going to deploy Prometheus and SNMP exporter to poll data from multi-vendor network running Cisco IOS XR, Nokia SR OS and Arista EOS network devices. Here is our topology:
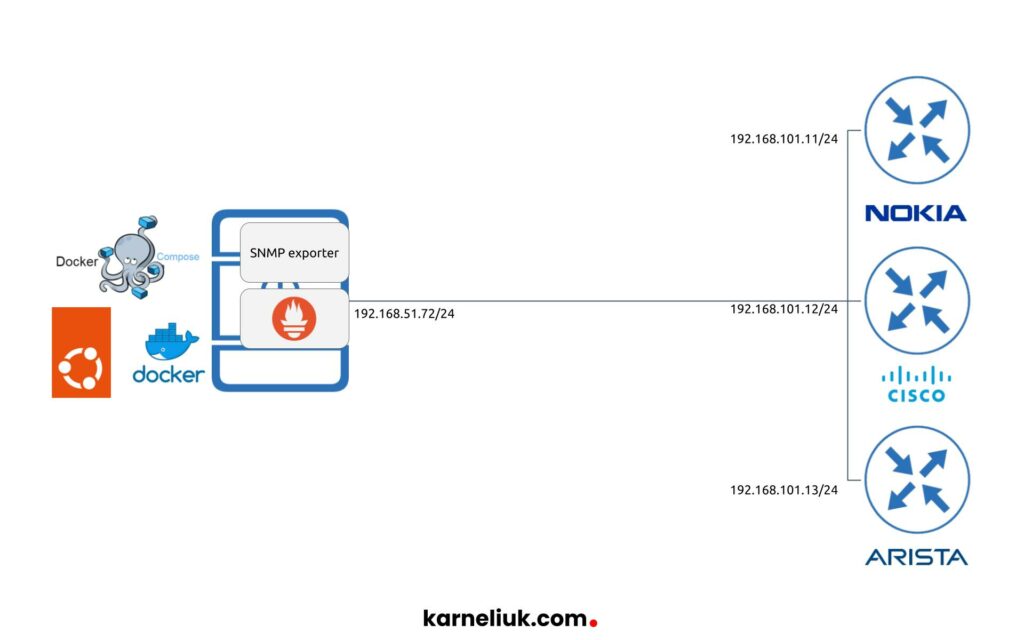
For the Prometheus part, we are running:
- Ubuntu Linux 22.04
- Docker Engine
- Docker Compose plugin to orchestrate the deployment of containers
We could run Prometheus on top of Kubernetes as well, and in general this would be a preferred way; however, that is out of scope for this lab
As network devices, we run:
- Cisco IOS XR 6.5.1
- Nokia SE OS 21.10.R1
- Arista EOS 4.28.1F
Enroll to our Zero-to-Hero Network Automation Trainings to become an expert in automation of Cisco, Nokia and Arista as well as to master Linux and Docker skills.
Solution Implementation
Step #1. Configure SNMPv3 in Cisco IOS XR, Nokia SR OS and Arista EOS
The very first step, before we jump into the deployment of Prometheus with SNMP exporter is to get SNMP configured and validated at network devices.
We are going to configure SNMP version 3, which is considered to be the most secure version. Actually, we did that before in our blog, so we are going to re-use the same configuration examples.
It is important though to validate our SNMP operation before moving to Prometheus. That will allow to ensure, if we have to troubleshoot the setup, we focus only on one known (e.g., only Prometheus part) rather than trying to solve multiple problems.
In Ubuntu Linux, you need to install the following packages:
2
$ sudo apt-get install snmp snmp-mibs-downloader -y
Once this is done, you can check SNMP operation:
2
3
4
5
6
7
8
9
10
11
12
13
14
15
16
17
18
19
20
21
22
23
24
25
IF-MIB::ifName.1 = STRING: system
IF-MIB::ifName.2 = STRING: oc_1/1/c1/1_0
IF-MIB::ifName.3 = STRING: oc_1/1/c2/1_0
IF-MIB::ifName.1610899520 = STRING: 1/1/c1
!
! FURTHER OUTPUT IS TRUNCATED FOR BREVITY
$ snmpwalk -v 3 -l authPriv -u Collector -a SHA -A SUPER_AUTH -x AES -X SUPER_PASS 192.168.101.12 IF-MIB::ifXTable
IF-MIB::ifName.2 = STRING: Null0
IF-MIB::ifName.3 = STRING: GigabitEthernet0/0/0/0
IF-MIB::ifName.4 = STRING: GigabitEthernet0/0/0/1
IF-MIB::ifName.5 = STRING: GigabitEthernet0/0/0/2
!
! FURTHER OUTPUT IS TRUNCATED FOR BREVITY
$ snmpwalk -v 3 -l authPriv -u Collector -a SHA -A SUPER_AUTH -x AES -X SUPER_PASS 192.168.101.13
IF-MIB::ifXTable
IF-MIB::ifName.1 = STRING: Ethernet1
IF-MIB::ifName.2 = STRING: Ethernet2
IF-MIB::ifName.999001 = STRING: Management1
!
! FURTHER OUTPUT IS TRUNCATED FOR BREVITY
Once SNMP v3 operation is validated, we can confidently say that this step is successfully completed. The next step is to setup the SNMP exporter.
Step #2. Setup SNMP Exporter
It is expected that you know how to install Docker. If not, read to this blogpost and enroll to Zero-to-Hero Network Automation Training.
Before we will though launch SNMP exporter, it is worth to spend some minutes talking about its configuration file. In the official documentation, it is suggested that you should create your configuration file. You definitely should do that if, you have some drivers, which are not part of the standard collection. If they are the part, though, you don’t have to do that and you can simply download that file and use it as a configuration one for your SNMP exporter. Let’s do it:
2
3
$ cd snmp_exporter
$ wget https://raw.githubusercontent.com/prometheus/snmp_exporter/main/snmp.yml -O config/snmp.yaml
Spend some time looking through it to identify what is in, what is not. For the purpose of this blogpost we will use the ifTable and ifXTable MIBs, which are part of this file. As such, we don’t need to generate the new SNMP file. However, we need to add credentials. To do so, we add to the corresponding module if_mib the information per our previous configuration:
2
3
4
5
6
7
8
9
10
11
12
13
14
15
16
17
! SOME OUTPUT IS TRUNCATED FOR BREVITY
!
if_mib:
version: 3
auth:
username: Collector
security_level: authPriv
password: SUPER_AUTH
auth_protocol: SHA
priv_protocol: AES
priv_password: SUPER_PASS
walk:
- 1.3.6.1.2.1.2
- 1.3.6.1.2.1.31.1.1
!
! FURTHER OUTPUT IS TRUNCATED FOR BREVITY
Now your configuration of SNMP exporter is ready and we can bring that up. The good thing is that you can, and generally should, do it before you bringing up the Prometheus itself, as SNMP exporter has built-in mechanism to test the operation of SNMP polling, which helps to:
- test connectivity towards the network devices to ensure that there is a reachability and SNMP port is not blocked
- test that SNMP credentials are accurate
- test that the chosen protocols of authentication and privacy (encryption) are correct
We stated that in this lab we are going to use Docker compose to orchestrate the deployment; therefore, we need to create the Docker Compose file for that:
2
3
4
5
6
7
8
9
10
11
12
---
version: "3.9"
services:
snmp:
restart: always
image: "prom/snmp-exporter:latest"
ports:
- "9116:9116"
volumes:
- "./config/snmp.yaml:/etc/snmp_exporter/snmp.yml"
__EOF__
Enroll to Zero-to-Hero Network Automation Training to master Docker and Docker-Compose skills
Bring the application up:
2
3
4
5
6
7
8
9
10
[+] Running 5/5
⠿ snmp Pulled 3.2s
⠿ 22b70bddd3ac Pull complete 0.6s
⠿ 5c12815fee55 Pull complete 1.1s
⠿ a80d1d2a0e12 Pull complete 1.5s
⠿ b6c49ac14299 Pull complete 1.7s
[+] Running 2/2
⠿ Network snmp_exporter_default Created 0.1s
⠿ Container snmp_exporter-snmp-1 Started 0.5s
Validate that container is up and running indeed:
2
10f48a33ba86 prom/snmp-exporter:latest "/bin/snmp_exporter …" 10 hours ago Up 10 hours 0.0.0.0:9116->9116/tcp, :::9116->9116/tcp snmp_exporter-snmp-1
As it looks to be properly up and running, you shall be able to connect it using the IP address of the host (per our lab topology it is 192.168.51.72) and the port 9116/TCP:

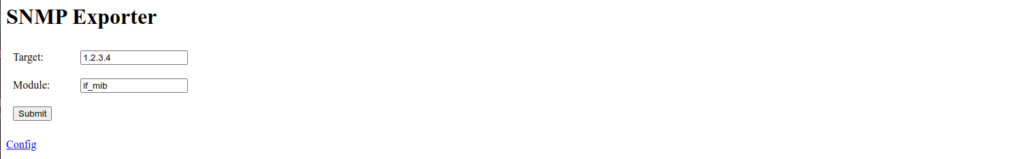
If you can see the same picture, it means that you are properly connected to network device. The next step is validate the operation of SNMP polling. Provide IP address or FQDN of the device you will be polling in the target filed and press Submit:

If credentials were accurate and the network device is reachable on the SNMP port, the polling shall be successful and you shall be able to see some metrics with or without labels.
Step #3. Setup Prometheus
Finally you should setup the Prometheus itself. As we have discussed previously the setup in general, we will focus now only on the SNMP job. Among others, there are some important considerations you should do, when you setup the scrapping with Prometheus:
- How much data points you want to collect?
- How close to real time you want to monitor the data?
- How frequently the network operating system updates counters/gauges in the network device?
- How much storage do you have?
In our case we want to be able to detect even relatively short spikes; therefore, we will setup scrape_interval for Prometheus to be 10 seconds. Be mindful, if you set such an aggressive time in the production network as may generate additional CPU/memory load on network devices as well as a significant amount of storage needed.
Let’s create config file for Prometheus:
2
3
4
5
6
7
8
9
10
11
12
13
14
15
16
17
18
19
20
21
22
23
24
25
26
27
$ cd ../prometheus
$ tee prometheus.yaml << __EOF__
---
global:
scrape_interval: 10s
scrape_timeout: 5s
evaluation_interval: 5s
scrape_configs:
- job_name: 'office1-snmp'
metrics_path: /snmp
params:
module: [if_mib]
static_configs:
- targets:
- 192.168.101.11
- 192.168.101.12
- 192.168.101.13
relabel_configs:
- source_labels: [__address__]
target_label: __param_target
- source_labels: [__param_target]
target_label: instance
- target_label: __address__
replacement: 172.18.0.2:9116
__EOF__
172.18.0.2 is an IP address of the SNMP Exporter, which was allocated by Docker automatically. You can get it using “docker container inspect snmp_exporter-snmp-1” command.
Now you can bring the Prometheus up, also using Docker compose:
2
3
4
5
6
7
8
9
10
11
12
13
14
15
16
17
18
19
20
21
22
23
---
version: "3.9"
services:
prometheus:
restart: always
image: "prom/prometheus"
ports:
- "9090:9090/tcp"
command:
- "--config.file=/etc/prometheus/prometheus.yaml"
- "--storage.tsdb.path=/prometheus"
- "--web.console.libraries=/usr/share/prometheus/console_libraries"
- "--web.console.templates=/usr/share/prometheus/consoles"
volumes:
- "./prometheus.yaml:/etc/prometheus/prometheus.yaml:ro"
- "prometheus_db:/prometheus"
volumes:
prometheus_db:
__EOF__
Start the Prometheus:
2
3
4
5
[+] Running 3/3
⠿ Network prometheus_default Created 0.1s
⠿ Volume "prometheus_clangm_prometheus_db" Created 0.0s
⠿ Container prometheus-prometheus-1 Started 0.8s
Check that it is up and running:
2
fbe8cce6bfc0 prom/prometheus "/bin/prometheus --c…" 25 hours ago Up 9 hours 0.0.0.0:9090->9090/tcp, :::9090->9090/tcp prometheus-prometheus-1
As our monitoring with Prometheus and SNMP exporter appears to be working, it is a time verify that.
Validation
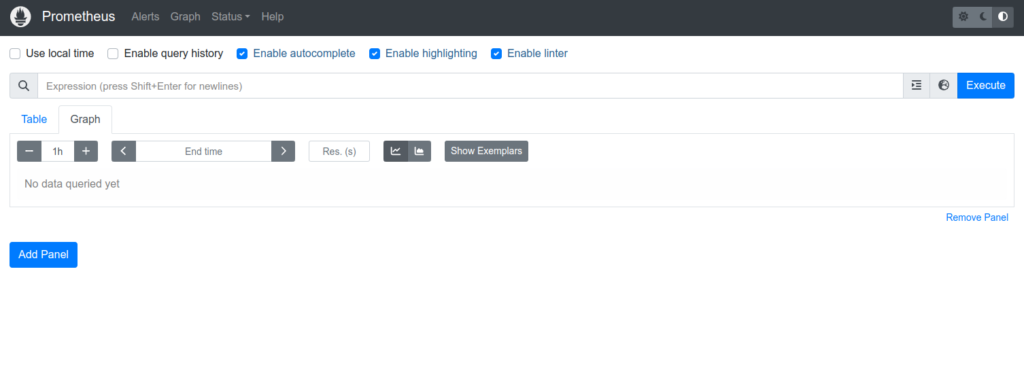
Connect to Prometheus UI using the IP address of the host (192.168.51.72) and the 9090/TCP port:

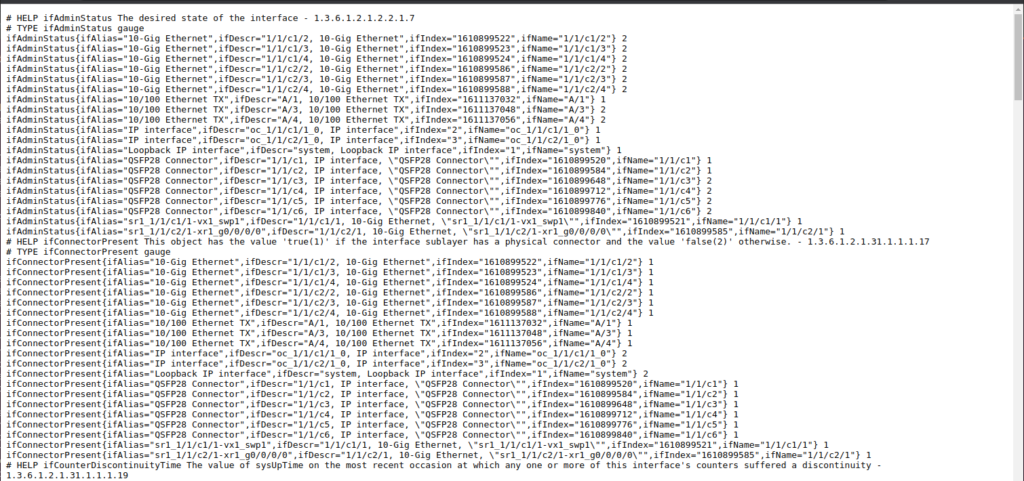
Explore the collected data. For example, type just “if” in the “Expression” field. You shall see a number of suggestions:

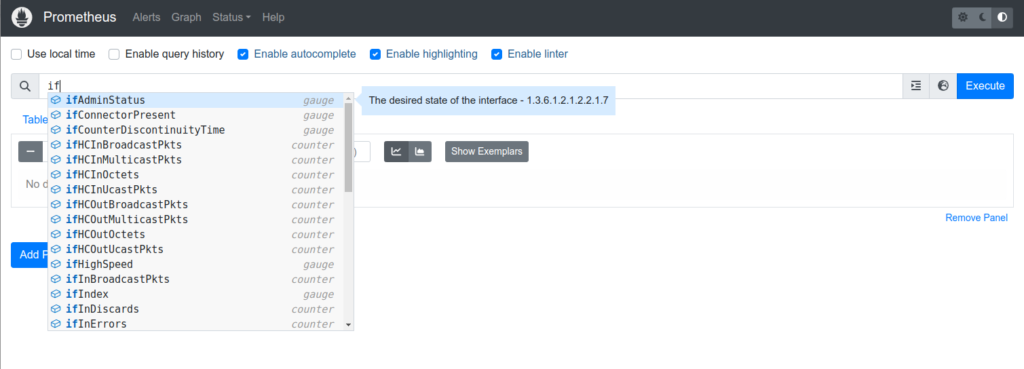
One of the useful graphs, which you can build is interfaces’ utilization in bps. In the field “Expression” type “rate(ifHCInOctets[1m])*8” and press “Execute“. You shall see, depending on the traffic levels in your network somewhat similar picture:

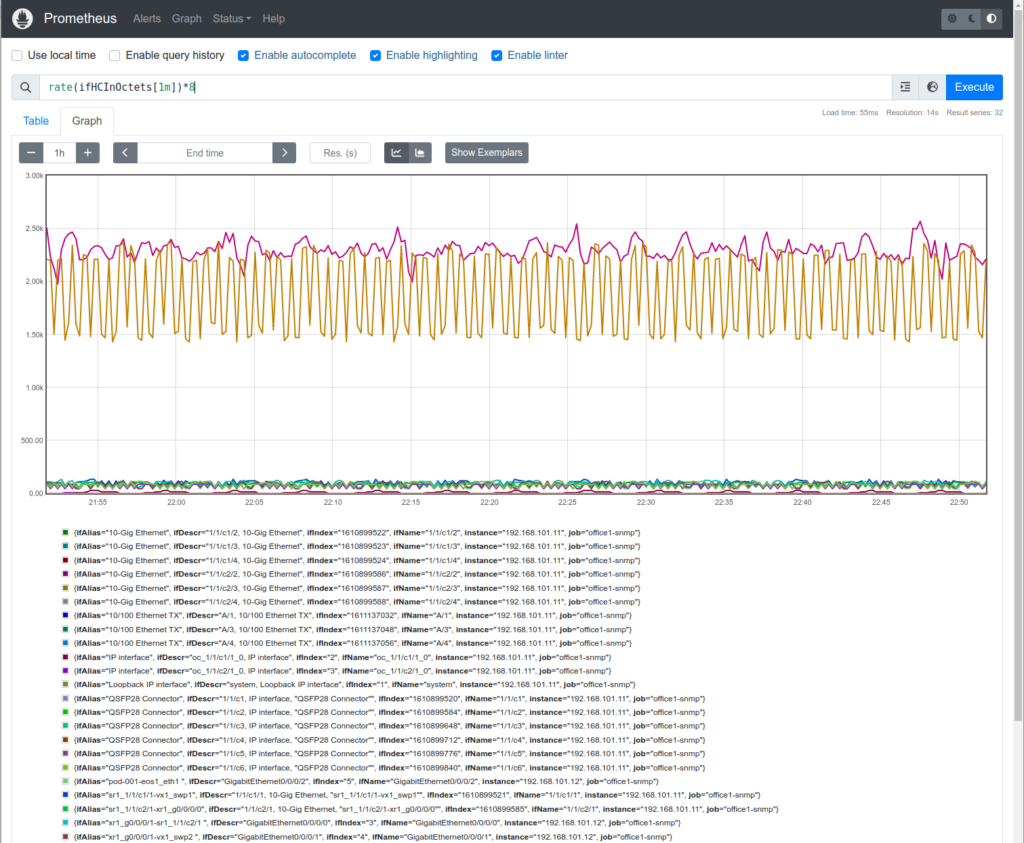
Woohoo, your monitoring of network with Prometheus leveraging SNMP is working.
By the way…
As you can see, the amount of information, various tools and patterns you may need to use in the modern networking is incredible. And it is getting just bigger. In order you can be successful in your job, whether you are an IT/network engineer caring about your career or manager/director/CTO caring about your network/IT infrastructure, we offer you the best training programs which are based on years of real-world experience of designing, building and operating network automation systems and solutions. Leverage our expertise to let you focus on your core tasks. Enroll yourself or your teams to our training programs and start training now.
Lessons Learned
Apparently, the biggest lessons learned for us was that it is important and useful to look in your past notes (i.e., blogposts). The main reason why we are writing blogposts is because we see that despite there is a huge amount of information worldwide, there is 99,99% amount of noise there. When we were configuring SNMP v3 on Cisco IOS XR and we went through the official documentation, there were some pieces missing. Same story for Nokia and Cisco IOS XR. however, when we started looking for further examples, we encountered our own blogpost back from 2019, which has simple and clear explanation how to configure SNMP v3 on the vendor of our choice. As a result, we saved a tremendous amount of time and focused on the core topic of the blog, which is SNMP Exporter for Prometheus.
Summary
If you take a look from 1000 feet overview, it may look that Prometheus is yet another monitoring system: we already have Nagios, Zabbix, LibreNMS, InfluxData/IndluxDB, and now Prometheus. The statement is absolutely fair. At the same time, the variety of tools, good Open Source tools, on the market gives you possibility to choose what fits your use case on the one hand, and what can be benefited by the wider enterprise context. ultimately, if you are able to reach that point that you have a single, though for sure highly redundant), monitoring system for your entire infrastructure, that would significantly simplify data correlation between different events and to make the holistic analysis. Take care and good bye!
Need Help? Contract Us
If you need a trusted and experienced partner to automate your network and IT infrastructure, get in touch with us.
P.S.
If you have further questions or you need help with your networks, we are happy to assist you, just send us a message. Also don’t forget to share the article on your social media, if you like it.
BR,
Anton Karneliuk