

Hello my friend,
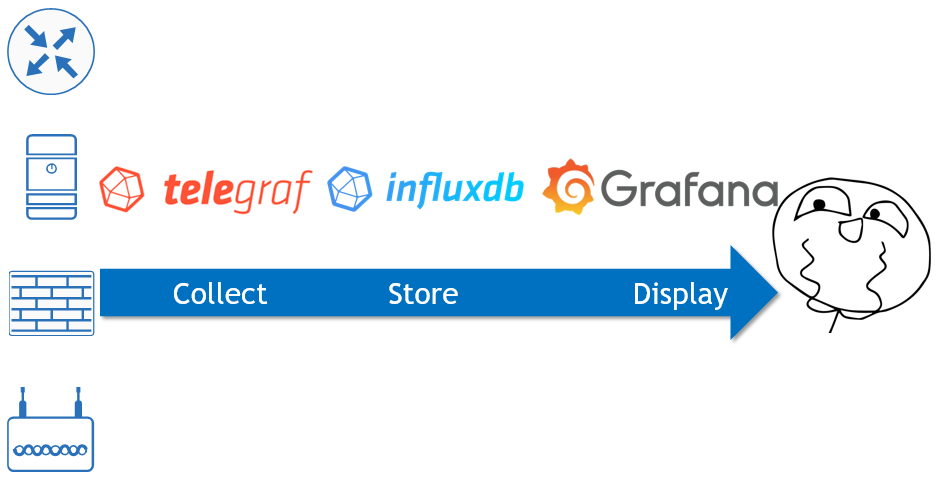
In the previous article we have shown, how to collect information about network health using SNMPv3. Today you will see how to use this information to monitor health of your network using one of the most popular stack today: Telegraf to collect the data, InfluxDB to store it and Grafana to visualize it. All these applications will be running as Docker containers. I’ve used plenty of hype words, so let’s deep dive on the topic.
2
3
4
5
retrieval system, or transmitted in any form or by any
means, electronic, mechanical or photocopying, recording,
or otherwise, for commercial purposes without the
prior permission of the author.
Disclaimer
Obviously, model-drive telemetry is much better than SNMP, but I haven’t found any open-source tool, which can collect multivendor telemetry over GRPC. I’ve heard some rumors that there will be soon released the plugin for Telegraf to collect telemetry over GRPC. That’s good, as we would need to change only the way of data collection. The rest will be same, as it’s described in this article.
Brief description
Data is the new oil. Though monitoring isn’t necessary sexy thing itself, it’s an essential for the production networks. If you don’t monitor your network, how can you be sure that everything is OK and there is no outages? Going further, all kind of closed-loop automation and self-healing of the networks end-to-end is built on the analysis of the collected information from the network states over the time and comparison it to the baseline.
About the closed-loop automation we will speak in the next articles.
As said, the information should be collected over the time. Here we have two important tasks.
The first one is storage of the information collected over the time in easy readable and accessible format. To do it there was developed a specific class of databases called TSDB (time series databases). Such databases are used, when you need to store the same set of information (like counters or other metrics) many times with different time stamps. Basically, we collect the same set of counters each 5 minutes and put it to the time series database. Then we can track the value of each counter over the time.
The second important task is actually collection of the information. For instance, if we use SNMP, we need to make sure we poll the counters regularly (each 5 or 10 seconds) parse the data and write it in the proper format into time-series database. If we use any other input of the information (hopefully, streaming model-driven telemetry soon), only the input format is different, but the rest is the same: parse data and write in the proper format into time-series database.
Such modularity and network vendor neutrality is the biggest advantage of using standard open-source tools comparing to vendor-closed solutions.
After the state data is collected and stored, there are two more important tasks arising. One task is the closed-loop automation, which is the most advanced and future-proof task. In a nutshell it means that the collected data is analyzed against some baseline and the automated actions is triggered, when the baseline is violated.
More details on closed-loop automation will be in the next chapters.
Another task is visualization of the collected data in form of various dashboards (ideally, both useful and fancy). Visualization is important for any kind of operational tasks, like manual verification of the network health and checking that closed-loop automation is working properly. In the world of full programmability, the role of visualization should decrease, cause the network should be fully self-healed, but for now it’s still very important to have it.
What are we going to test?
We are going to deploy Docker infrastructure on the management host, where all the necessary applications can run as containers:
- Container with InfluxDB, which is time series database, will store all collected SNMP data
- Container with Telegraf will actually collect network state using SNMPv3 over IPv6
- Container with Grafana will visualize information out of InfluxDB for a dashboard.
Software version
The following software components are used in this lab.
Management host:
- CentOS 7.5.1804 with python 2.7.5
- Ansible 2.7.0
- Docker-CE 18.09
- Containerized Telegraf 1.9.4
- Containerized InfluxDB 1.9.4
- Containerized Grafana 1.9.4
Service Provider Fabric:
- Nokia SR OS 16.0.R5 [guest VNF]
- Arista EOS 4.21.1.1F [guest VNF]
- Cisco IOS XR 6.5.1 [guest VNF]
- Cumulus Linux 3.7.2 [guest VNF]
More details about Service Provider Fabric you may find in the previous articles.
Topology
Since the previous article the management topology has significantly evolved:
2
3
4
5
6
7
8
9
10
11
12
13
14
15
16
17
18
19
20
21
22
23
24
25
26
27
28
29
30
31
32
33
34
| |
| /\/\/\/\/\/\/\/\/\/\/\/\/\/\/\/\/\/\/\/\/\/\/\ |
| / \ |
| / +----------+ +----------+ +---------+ \ |
| \ | Telegraf | | InfluxDB | | Grafana | \ |
| / +----+-----+ +-----+----+ +----+----+ / |
| \ | .4/:4 | .2/:2 | .3/:3 \ |
| / | | | / |
| \ +--------+------+-------------+ \ |
| / | Container network: / |
| \ | docker0 172.17.0.0/16 \ |
| \ | .1/:1 fc00:ffff:1::/64 / |
| +-------------+ \ +--------+--------+ / |
| | Internet GW | \/\/\/| management host |/\/\/\/\/\/\/\/\/\/\/ |
| +------+------+ +--------+--------+ |
| | eth1 | ens33 |
| | .2/:2 | .136/:A OOB: 192.168.141.0/24 |
| | | fc00::192:168:1:0/112 |
| | | |
| +---+-----------+--------------+--------------+-------------+ |
| | | | | | |
| | BOF (Eth) | MgmtEth0 | Management1 | Management1 | eth0 |
| | .101/:A1 | .51/:51 | .71/:71 | .72/:72 | .84/:84 |
| +---+---+ +---+---+ +---+---+ +---+---+ +---+---+ |
| | SR1 | | XR1 | | EOS1 | | EOS2 | | VX4 | |
| +-------+ +-------+ +-------+ +-------+ +-------+ |
| |
+-------------------------------------------------------------------------------+
Communication outside container network:
- IPv4: NAT to ens33 IPv4 address of management host
- IPv6: Routing --> VNFs must have route to fc00:ffff:1::/64 over
management interface
The major changes are the following:
- Communication between VNFs and management host on OOB is dual-stack IPv4/IPv6 enabled
- The “/etc/hosts” on the management host contains only IPv6 mappings for VNF hostnames, so all communication between the management host to VNs or Docker containers to VNF is IPv6 only.
- Management host runs Docker infrastructure with default “bridge” network enabled with dual-stack IPv4/IPv6
- For connectivity with IPv4 world, containers’ subnet 172.17.0.0/16 is NATed to ens33 IPv4 address of the management host (192.168.141.136)
- For connectivity with IPv6 world, containers’ subnet fc00:ffff:1::/64 must be routed outside the Docker “bridge” network.
- Container with Telegraf has IPv4 172.17.0.4/16 and IPv6 fc00:ffff:1::242:ac11:4/64
- Container with InfluxDB has IPv4 172.17.0.2/16 and IPv6 fc00:ffff:1::242:ac11:2/64
- Container with Grafana has IPv4 172.17.0.3/16 and IPv6 fc00:ffff:1::242:ac11:3/64
- Communication between the container themselves is also dual-stack enabled and should use IPv6 if application supports
You can use any hypervisor of your choice (KVM, VMWare Player/ESXI, etc). For KVM you can use corresponding cheat sheet for VM creation.
On the other hand there is no single difference in the logical topology of the Service Provider Fabric:
2
3
4
5
6
7
8
9
10
11
12
13
14
15
16
17
18
19
20
21
22
23
24
25
26
27
28
29
30
31
32
33
| |
| L0: |
| 10.0.0.22/32 |
| fc00::10:0:0:22/128 10.1.22.0/24 |
| (Metric: 10) fc00::10:1:22:0/112 |
| +---------------+ (Metric: 10) |
| | EOS1 (SID:22) |(Eth2)+----------------------+ |
| +---------------+ .22/:22 | |
| (Eth1) | |
| + .22/:22 + .1/:1 10.1.44.0/24 |
| | (Eth1) fc00::10:1:44:0/112 |
| | 10.22.33.0/24 +--------------+ (Metric: 10) +----------------+ |
| | fc00::10:22:33:0/112 | EOS2 (SID:1) |(Eth3)+--------------+(Eth3)| SR1 (SID: 44) | |
| | (Metric: 100) +--------------+ .1:/1 .44/:44 +----------------+ |
| | (Eth2) |
| + .33/:33 + .1/:1 L0: system: |
| (G0/0/0/0) | 10.0.0.1/32 10.0.0.44/32 |
| +---------------+ | fc00::10:0:0:1/128 fc00::10:0:0:44/128 |
| | XR1 (SID:33) |(G0/0/0/1)+------------------+ (Metric: 10) (Metric: 10) |
| +---------------+ .33/:33 (Metric: 10) |
| 10.1.33.0/24 |
| L0: fc00::10:1:33:0/112 |
| 10.0.0.33/32 |
| fc00::10:0:0:33/128 |
| (Metric: 10) ISIS 0 (CORE) / level 2 / Segment Routing |
| |
| ASN: 65000 |
| |
| Full iBGP mesh for VPNV4 UNICAST, VPNV6 UNICAST |
| and L2VPN EVPN between loopbacks of all PEs |
| |
+-------------------------------------------------------------------------------------------------------------+
The absence of differences or new configurations is caused by the fact that we are focusing now on the management part as explained before. The assumption is that we have network with the services up and running , what needs just to be monitored.
The topologies and initial configuration files you can find on my GitHub.
Architecture of the Service Provider Fabric monitoring
You have already read the high-level description, how the monitoring of the network should work. You have also seen the routing and other communication details. The following picture should bring all the pieces together and provide you end-to-end picture describing how we collect, store, and visualize states and metrics from out Service Provider Fabric:
2
3
4
5
6
7
8
9
10
11
12
13
14
15
16
17
18
19
20
21
22
23
24
25
26
27
28
29
+-----------------------------------------------------------------------------------------+
| |
| Monitoring of Service Provider Fabric using InfluxData TICK + Grafana |
| |
| +--------------+ +--------------+ +--------------+ |
| | | | | | | |
| | Telegraf +---[PUSH]-->+ InfluxDB +<--[POLL]---+ Grafana | |
| | (Collect) | | (Store) | | (Visualize) | |
| | | | | | | |
| +--------+-----+ +--------------+ +--------------+ |
| | |
| | SNMPv3 over IPv6 |
| | |
| +------------+---[POLL]---+------------+------------+ |
| | | | | | |
| /\/\|/\/\/\/\/\/\|/\/\/\/\/\/\|/\/\/\/\/\/\|/\/\/\/\/\/\|/\/\/\ |
| / v v v v v \ |
| / +--+---+ +--+---+ +--+---+ +--+---+ +--+---+ \ |
| \ | | | | | | | | | | / |
| / | EOS1 | | EOS2 | | SR1 | | XR1 | | VX4 | \ |
| \ | | | | | | | | | | / |
| / +------+ +------+ +------+ +------+ +------+ \ |
| \ / |
| / Service Provider Fabric + Customers network functions / |
| \ / |
| \/\/\/\/\/\/\/\/\/\/\/\/\/\/\/\/\/\/\/\/\/\/\/\/\/\/\/\/\/\/\_/ |
| |
+-----------------------------------------------------------------------------------------+
Just to remind, all the applications (Telegraf, InfluxDB, Grafana) are running as Docker containers. You might have the questions “why”. Besides the answer “because I can”, there are a couple of other more valuable answers:
- Communication between applications is done using network: each application is listening and sending traffic on the certain TCP or UDP port.
- Each application is independent not related to each other.
- Each application may require certain dependencies or additional package, which are not required by another application or by management host.
- In case of SW update of any new component, we just need to download new container and that’s it.
All these facts for me is good enough justification to containerize the necessary applications for this particular lab and in future as well.
The next important point is the way, how the network states is collected. We are using SNMPv3 in the way we have described in the previous article. The only difference is that OOB is switched now primarily to IPv6. I’m doing currently a couple of IPv6-related projects and suddenly understood that being IPv6 advocate, I don’t use it myself too much. It took a me a bit to understand, how to integrate IPv6 support in Docker and especially what to do with built-in Linux firewall “ip6tables” to allow IPv6 communication between containers and related VNFs.
The last key point I’d like to highlight here is the security. Every week you can read some news about security threats or breaches, data theft and so on. All these raise the concert about security as a paramount requirement by designing and implementing any system, not just nice to have feature. From the monitoring architecture prospective, we have the following security features implemented:
- Collection of network state information over SNMPv3 is used “authPriv” security-model, what includes both authtentication and encryption of the transmitted data.
- Communication Telegraf — InfluxDB and Grafana – InfluxDB is running over HTTPS for transmitted data encryption with access to InfluxDB via credentials borh for Telegraf and Grafana.
- Communication between user and Grafana GUI uses HTTPS as well.
Basically, we are aiming to secure all kind of communications between VNFs and containers, and between different containers themselves.
Once the architecture is clarified, we can go for its implementation.
#1. Deploying Docker container infrastructure
The first step in the deployment of our monitoring infrastructure is to prepare the platform, our “cloud”. To do this, we need to install Docker. There is a very good official guide from Docker, which I have used myself. I just need to repeat some steps they are showing:
2
3
4
5
6
7
8
9
10
11
device-mapper-persistent-data \
lvm2
$ sudo yum-config-manager \
--add-repo \
https://download.docker.com/linux/centos/docker-ce.repo
$ sudo yum install docker-ce docker-ce-cli containerd.io
So in the steps above we have installed tools necessary to add new repository with Docker, then we have added the repository itself and installed Docker and related components.
Point out, we don’t launch Docker yet as we need to enable it with IPv6.
Some investigations on Docker web-site helped to find the proper guide, which explains how the configuration of “demon.json” for Docker should look like:
2
3
4
5
{
"ipv6": true,
"fixed-cidr-v6": "fc00:ffff:1::/64"
}
For me this file wasn’t existing, so I created in myself using “sudo”.
After we have created the file, we can start Docker:
2
3
4
5
6
7
8
9
10
11
12
13
14
15
16
17
18
19
20
21
22
23
24
25
$ sudo systemctl status docker
● docker.service - Docker Application Container Engine
Loaded: loaded (/usr/lib/systemd/system/docker.service; disabled; vendor preset: disabled)
Active: active (running) since Fri 2019-03-08 17:28:03 CET; 3s ago
Docs: https://docs.docker.com
Main PID: 13417 (dockerd)
Tasks: 10
Memory: 115.5M
CGroup: /system.slice/docker.service
└─13417 /usr/bin/dockerd -H fd:// --containerd=/run/containerd/containerd.sock
Mar 08 17:28:02 sand7.karneliuk.com dockerd[13417]: time="2019-03-08T17:28:02.326945710+01:00" level=info msg="pickfirstBalancer: HandleSubConnStat...ule=grpc
Mar 08 17:28:02 sand7.karneliuk.com dockerd[13417]: time="2019-03-08T17:28:02.378282691+01:00" level=info msg="[graphdriver] using prior storage dr...verlay2"
Mar 08 17:28:02 sand7.karneliuk.com dockerd[13417]: time="2019-03-08T17:28:02.500606454+01:00" level=info msg="Graph migration to content-addressab...seconds"
Mar 08 17:28:02 sand7.karneliuk.com dockerd[13417]: time="2019-03-08T17:28:02.501515662+01:00" level=info msg="Loading containers: start."
Mar 08 17:28:03 sand7.karneliuk.com dockerd[13417]: time="2019-03-08T17:28:03.071903691+01:00" level=info msg="Default bridge (docker0) is assigned...address"
Mar 08 17:28:03 sand7.karneliuk.com dockerd[13417]: time="2019-03-08T17:28:03.259182105+01:00" level=info msg="Loading containers: done."
Mar 08 17:28:03 sand7.karneliuk.com dockerd[13417]: time="2019-03-08T17:28:03.397315137+01:00" level=info msg="Docker daemon" commit=774a1f4 graphd...=18.09.3
Mar 08 17:28:03 sand7.karneliuk.com dockerd[13417]: time="2019-03-08T17:28:03.398104265+01:00" level=info msg="Daemon has completed initialization"
Mar 08 17:28:03 sand7.karneliuk.com dockerd[13417]: time="2019-03-08T17:28:03.420088797+01:00" level=info msg="API listen on /var/run/docker.sock"
Mar 08 17:28:03 sand7.karneliuk.com systemd[1]: Started Docker Application Container Engine.
Hint: Some lines were ellipsized, use -l to show in full.
You can enable Docker to start upon boot-up, but I don’t do this. Refer to original documentation mentioned before.
Our cloud platform is ready, so we can check that Docker is up and running:
2
3
4
5
6
7
8
9
10
11
12
13
14
15
16
17
18
19
20
21
22
23
24
25
26
27
28
29
30
31
32
33
34
35
36
37
38
39
40
41
42
43
44
45
46
Containers: 0
Running: 0
Paused: 0
Stopped: 0
Images: 22
Server Version: 18.09.3
Storage Driver: overlay2
Backing Filesystem: xfs
Supports d_type: true
Native Overlay Diff: true
Logging Driver: json-file
Cgroup Driver: cgroupfs
Plugins:
Volume: local
Network: bridge host macvlan null overlay
Log: awslogs fluentd gcplogs gelf journald json-file local logentries splunk syslog
Swarm: inactive
Runtimes: runc
Default Runtime: runc
Init Binary: docker-init
containerd version: e6b3f5632f50dbc4e9cb6288d911bf4f5e95b18e
runc version: 6635b4f0c6af3810594d2770f662f34ddc15b40d
init version: fec3683
Security Options:
seccomp
Profile: default
Kernel Version: 3.10.0-957.5.1.el7.x86_64
Operating System: CentOS Linux 7 (Core)
OSType: linux
Architecture: x86_64
CPUs: 2
Total Memory: 5.651GiB
Name: sand7.karneliuk.com
ID: A6Y2:IGRF:TK36:EI42:WD6O:Y5AR:BFN6:AWA2:NRMA:LDUN:M26L:MDDK
Docker Root Dir: /var/lib/docker
Debug Mode (client): false
Debug Mode (server): false
Username: akarneliuk
Registry: https://index.docker.io/v1/
Labels:
Experimental: false
Insecure Registries:
127.0.0.0/8
Live Restore Enabled: false
Product License: Community Engine
This output contains general information about Docker and the system it’s running on. If you can see the output, it means that Docker is OK in general. Additionally we can check configuration of default network interface:
2
3
4
5
6
7
8
9
10
11
12
13
14
15
16
17
18
19
20
21
22
23
24
25
26
27
28
29
30
31
32
33
34
35
36
37
38
39
40
41
42
[
{
"Name": "bridge",
"Id": "cbcb74f9c12e43797a20ff591ca7d62de56102197080d3a2eba6497312645163",
"Created": "2019-03-08T17:28:03.07240658+01:00",
"Scope": "local",
"Driver": "bridge",
"EnableIPv6": true,
"IPAM": {
"Driver": "default",
"Options": null,
"Config": [
{
"Subnet": "172.17.0.0/16",
"Gateway": "172.17.0.1"
},
{
"Subnet": "fc00:ffff:1::/64",
"Gateway": "fc00:ffff:1::1"
}
]
},
"Internal": false,
"Attachable": false,
"Ingress": false,
"ConfigFrom": {
"Network": ""
},
"ConfigOnly": false,
"Containers": {},
"Options": {
"com.docker.network.bridge.default_bridge": "true",
"com.docker.network.bridge.enable_icc": "true",
"com.docker.network.bridge.enable_ip_masquerade": "true",
"com.docker.network.bridge.host_binding_ipv4": "0.0.0.0",
"com.docker.network.bridge.name": "docker0",
"com.docker.network.driver.mtu": "1500"
},
"Labels": {}
}
]
From the prospective of Service Provider Fabric it’s important to find in the output below that IPv6 is enabled, IPv6 subnet is provided and that default gateway is settled both for IPv4 and IPv6. Also you can see that communication of IPv4 subnet to outside world is done over NAT (“ip_masquerade”).
Our cloud platform is ready, but we still need to the last modification on the management host. Docker automatically updates the Linux firewall “iptables” for IPv4 traffic, but doesn’t do anything for IPv6. That’s why need explicitly allow SNMP over IPv6 between Docker and Service Provider Fabric OOB IPv6 addresses using “ip6tables”:
2
$ sudo ip6tables -I FORWARD 2 -p udp --sport 161 -j ACCEPT
To check that rules are properly applied, you can verify content of “FORWARD” chain:
2
3
4
5
6
7
8
9
10
11
12
13
14
Chain FORWARD (policy ACCEPT)
target prot opt source destination
ACCEPT udp anywhere anywhere udp dpt:snmp
ACCEPT udp anywhere anywhere udp spt:snmp
ACCEPT all anywhere anywhere ctstate RELATED,ESTABLISHED
ACCEPT all anywhere anywhere
FORWARD_direct all anywhere anywhere
FORWARD_IN_ZONES_SOURCE all anywhere anywhere
FORWARD_IN_ZONES all anywhere anywhere
FORWARD_OUT_ZONES_SOURCE all anywhere anywhere
FORWARD_OUT_ZONES all anywhere anywhere
DROP all anywhere anywhere ctstate INVALID
REJECT all anywhere anywhere reject-with icmp6-adm-prohibited
Now the infrastructure is fully ready for deployment of monitoring services, how it is shown in subsequent steps.
#2. Deploying InfluxDB to store time series data as Docker container
The first application from the monitoring architecture we deploy on Docker is InfluxDB. As explained earlier, it’s a time-series database (TSDB), which in our case stores pulled SNMP information. That’s exactly the reason, why we deploy InfluxDB first: Telegraf needs to write into InfluxDB and Grafana needs to read from InfluxDB.
First of all, let’s create a folder, where will store some persistent data from containers, like content of the database:
2
3
4
5
6
7
8
/home/aaa
$ mkdir containers
$ cd containers
$ mkdir influxdb
$ cd influxdb
$ pwd
/home/aaa/containers/influxdb
Now we can proceed with the InfluxDB itself.
There is an official documentation how to run InfluxDB as container available. So, first of all we need to create a configuration file for InfluxDB, which we will modify later on:
For the first launch, we don’t need to change anything in this config file, but later on we will update it. To store the files of DB, we can create a persistent storage or mount a folder on your management host to container. We do the latter one and then start the container with InfluxDB:
2
3
4
5
6
$ sudo docker run -d -p 8086:8086 -p 8088:8088 \
-v $PWD/influxdb.conf:/etc/influxdb/influxdb.conf:ro \
-v $PWD/data:/var/lib/influxdb \
influxdb -config /etc/influxdb/influxdb.conf
9555a61596365da127e13f7678a3d084ec1c59ae7ebd3423ee840be4dec77864
If you aren’t familiar with containers, it is OK. I had zero experience myself until I started writing this article, but it turned out that Docker is very user-friendly tool.
With the command above we start the container with InfluxDB (container‘s name “influxdb”) and exposing ports 8086 and 8088 to be NATted to IP addresses of management host. We also map configuration file “influxdb.conf” and created folder “data” to corresponding files “/etc/influxdb/influxdb.conf” in read-only (“:ro”) mode and folder “/var/lib/influxdb” for full access. Finally we instruct InfluxDB to use mapped configuration “-config /etc/influxdb/influxdb.conf”.
First of all, we check if the container is up and running:
2
3
CONTAINER ID IMAGE COMMAND CREATED STATUS PORTS NAMES
9555a6159636 influxdb "/entrypoint.sh -con…" About an hour ago Up About an hour 0.0.0.0:8086->8086/tcp, 0.0.0.0:8088->8088/tcp agitated_brown
As you can see the status is “Up”, which means that the container with InfluxDB is running, so we can focus now on InfluxDB itself.
There are different ways, how to interact with InfluxDB: either through CLI or HTTP API. We will use HTTP API, that’s why we use proper documentation.
First of all we need to verify that InfluxDB application is working:
2
3
4
5
6
7
8
HTTP/1.1 204 No Content
Content-Type: application/json
Request-Id: e7ce6010-42b2-11e9-8001-0242ac110002
X-Influxdb-Build: OSS
X-Influxdb-Version: 1.7.4
X-Request-Id: e7ce6010-42b2-11e9-8001-0242ac110002
Date: Sat, 09 Mar 2019 21:32:57 GMT
As we got response, it means that application is working properly and we can proceed further with configuration. Though there are many options for configuration, we need to do only two things:
- Create database
- Create user credentials, which will be used to read/write information from the database.
We do both actions via HTTP API:
2
$ curl -XPOST http://localhost:8086/query --data-urlencode "q=CREATE USER spf_workforce WITH PASSWORD 'spf_w0rkf0rc3' WITH ALL PRIVILEGES"
If you are familiar with SQL, you can see that requests are very much SQL-like.
Configuration of database is done. The next step is to create SSL certificate for the container with InfluxDB:
2
3
4
5
6
Generating a RSA private key
.............................................+++++
...............+++++
writing new private key to '/etc/ssl/influxdb-selfsigned.key'
-----
So far all the preparation is done, and we need to update the configuration file “influxdb.conf” to enable HTTPS and authentication for database:
2
3
4
5
6
7
8
9
! OUTPUT IS OMITTED
[http]
auth-enabled = true
! OUTPUT IS OMITTED
https-enabled = true
https-certificate = "/etc/ssl/influxdb-selfsigned.crt"
https-private-key = "/etc/ssl/influxdb-selfsigned.key"
! OUTPUT IS OMITTED
After the update in configuration file is done, we need to restart the container to apply it:
From now on, InfluxDB is accesible only over HTTPS:
2
3
4
5
6
7
8
9
10
$ curl -i https://localhost:8086/ping --insecure
HTTP/1.1 204 No Content
Content-Type: application/json
Request-Id: 7968dde6-42bf-11e9-8001-0242ac110002
X-Influxdb-Build: OSS
X-Influxdb-Version: 1.7.4
X-Request-Id: 7968dde6-42bf-11e9-8001-0242ac110002
Date: Sat, 09 Mar 2019 23:02:55 GMT
As you can see, if we try to connect over HTTP, we can’t see any content, whereas on HTTPS we have the output. We need to add key “–insecure”, as the certificate is self-signed, and the host can’t prove it’s validity. We also can check if authentication works:
2
3
4
5
6
{"error":"unable to parse authentication credentials"}
$ curl -G 'https://localhost:8086/query?u=spf_workforce&p=spf_w0rkf0rc3' --data-urlencode "db=spf" --data-urlencode "q=SELECT * FROM spf" --insecure
{"results":[{"statement_id":0}]}
In the first case, we don’t have any reply, and in the second there is an output.
The InfluxDB is done and we can go to next applications. But before, we need to get IP address of the InfluxDB container, so that we other applications knows how to reach it. All the information about the container you can get by issuing “sudo docker container inspect $container_id” command. There are a lot of information and we leave for you to review it all, so we filter the output only to IP address:
2
172.17.0.2
Let’s go further.
#3. Deploying Telegraf for data collection as Docker container
After time-series database is installed, we can start feeding it with data, so proceed with installation of Telegraf. We will create the folder for it as well to store the configuration file, like we did previously:
2
/home/aaa/containers/telegraf
Once it’s done, we retrieve the configuration file, exactly in the same way we did previously for InfluxDB:
In the configuration file of Telegraf there is configuration for all input, processing and output plugins. This information is commented, so we need to find proper block, uncoment and modify it. Let’s start with communication of Telegraf to InfluxDB:
2
3
4
5
6
7
8
9
10
11
12
13
14
15
16
17
18
19
20
21
22
23
24
25
26
27
28
29
30
! OUTPUT IS OMITTED
###############################################################################
# OUTPUT PLUGINS #
###############################################################################
# Configuration for sending metrics to InfluxDB
[[outputs.influxdb]]
## The full HTTP or UDP URL for your InfluxDB instance.
urls = ["https://172.17.0.2:8086"]
## The target database for metrics; will be created as needed.
database = "spf"
## If true, no CREATE DATABASE queries will be sent. Set to true when using
## Telegraf with a user without permissions to create databases or when the
## database already exists.
skip_database_creation = false
## Timeout for HTTP messages.
timeout = "5s"
## HTTP Basic Auth
username = "spf_workforce"
password = "spf_w0rkf0rc3"
## Use TLS but skip chain & host verification
insecure_skip_verify = true
! OUTPUT IS OMITTED
The good point is that there are a lot of hints, what and how to configure in this file. What we put there:
- IP address of the container with InfluxDB “172.17.0.2”, we have figured out by the end of previous point over “https”.
- Database name “spf” and skip the creation of the database, if it doesn’t exist.
- Timeout for connectvity with HTTP “5s”.
- Credentials to connect to database.
- Skip verification of SSL certificate.
Besides connectivity to the InfluxDB database we need also to configure SNMP collection plugin:
2
3
4
5
6
7
8
9
10
11
12
13
14
15
16
17
18
19
20
21
22
23
24
25
26
27
28
29
30
31
32
33
34
35
36
37
38
39
40
41
42
! OUTPUT IS OMITTED
###############################################################################
# INPUT PLUGINS #
###############################################################################
# # Retrieves SNMP values from remote agents
[[inputs.snmp]]
agents = [ "XR1:161", "EOS1:161", "EOS2:161", "SR1:161", "VX4:161" ]
## SNMPv3 auth parameters
sec_name = "Collector"
auth_protocol = "SHA" # Values: "MD5", "SHA", ""
auth_password = "SUPER_AUTH"
sec_level = "authPriv" # Values: "noAuthNoPriv", "authNoPriv", "authPriv"
priv_protocol = "AES" # Values: "DES", "AES", ""
priv_password = "SUPER_PASS"
## measurement name
name = "system"
[[inputs.snmp.field]]
name = "hostname"
oid = "SNMPv2-MIB::sysName.0"
is_tag = true
[[inputs.snmp.table]]
name = "interfaceX"
inherit_tags = [ "hostname" ]
oid = "IF-MIB::ifXTable"
[[inputs.snmp.table.field]]
name = "ifName"
oid = "IF-MIB::ifName"
is_tag = true
[[inputs.snmp.table]]
name = "interface"
inherit_tags = [ "hostname" ]
oid = "IF-MIB::ifTable"
[[inputs.snmp.table.field]]
name = "ifName"
oid = "IF-MIB::ifName"
is_tag = true
! OUTPUT IS OMITTED
The following steps are taken here:
- We provide list of hosts: XR1, SR1, EOS1, EOS2; and related UDP port for SNMP.
- All SNMPv3 parameters, as we have configured in previous lab.
- Interested MIBs and tables.
Once we have properly modified the configuration file, we launch the container with Telegraf:
2
3
4
5
6
7
8
9
> -v $PWD/telegraf.conf:/etc/telegraf/telegraf.conf:ro \
> --add-host="XR1:fc00::192:168:141:51" \
> --add-host="EOS1:fc00::192:168:141:71" \
> --add-host="EOS2:fc00::192:168:141:72" \
> --add-host="SR1:fc00::192:168:1:a1" \
> --add-host="VX4:fc00::192:168:141:84" \
> telegraf -config /etc/telegraf/telegraf.conf
1ac04b4355b291df86896cb05c8ad6551e7f159f57d1d9ff5e520eca1be9bf7d
Most of the parameters for Telegraf containers we have explained previously for InfluxDB. What is new here is the “–add-host” key, which adds entries into “/etc/hosts” of the containers, so that it can resolve hostnames to IPv4 or IPv6 addresses.
When the container is started, we can see it’s up and running:
2
3
4
CONTAINER ID IMAGE COMMAND CREATED STATUS PORTS NAMES
1ac04b4355b2 telegraf "/entrypoint.sh -con…" 25 minutes ago Up 25 minutes 0.0.0.0:8092->8092/tcp, 8092/udp, 0.0.0.0:8094->8094/tcp, 8125/udp, 0.0.0.0:8125->8125/tcp keen_cohen
9555a6159636 influxdb "/entrypoint.sh -con…" 21 hours ago Up 19 hours 0.0.0.0:8086->8086/tcp, 0.0.0.0:8088->8088/tcp agitated_brown
In CentOS there is necessary to download proper SNMP MIBs to the Docker container with Telegraf and restart container:
2
3
$ sudo docker restart 1ac04b4355b2
1ac04b4355b2
This is might be necessary (or might be not), as it’s a bug. Read this thread for more details.
We can verify that Telegraf is properly working by checking the content of the InfluxDB database:
2
3
4
5
6
7
8
9
10
11
12
13
14
15
16
17
18
19
20
21
22
23
24
25
26
27
28
29
30
31
32
33
34
35
36
37
38
39
40
41
42
43
44
45
46
47
48
49
50
51
52
53
54
55
56
57
58
59
60
{
"results": [
{
"statement_id": 0,
"series": [
{
"name": "interfaceX",
"columns": [
"time",
"agent_host",
"host",
"hostname",
"ifAlias",
"ifConnectorPresent",
"ifCounterDiscontinuityTime",
"ifHCInBroadcastPkts",
"ifHCInMulticastPkts",
"ifHCInOctets",
"ifHCInUcastPkts",
"ifHCOutBroadcastPkts",
"ifHCOutMulticastPkts",
"ifHCOutOctets",
"ifHCOutUcastPkts",
"ifHighSpeed",
"ifInBroadcastPkts",
"ifInMulticastPkts",
"ifLinkUpDownTrapEnable",
"ifName",
"ifOutBroadcastPkts",
"ifOutMulticastPkts",
"ifPromiscuousMode"
],
"values": [
[
"2019-03-07T09:25:00Z",
"EOS1",
"001a402f8684",
"EOS1",
null,
1,
0,
0,
0,
0,
0,
0,
1037,
1200066,
0,
0,
0,
0,
1,
"Ethernet1",
0,
1037,
2
],
! OUTPUT IS OMITTED
We can see some numbers and strings meaning Telegraf is working properly.
#4. Deploying Grafana for data visualization as Docker container
Grafana is the last piece of the monitoring stack. We deploy it as container as well:
2
3
4
5
6
7
8
/home/aaa/containers/grafana
$ mkdir data
$ sudo docker run -d -p 3000:3000 \
> --user root \
> -v $PWD/data:/var/lib/grafana \
> grafana/grafana
acdfa26ed2cf2b9c004a8b2d06bf3f4692ce6344d9b65cdee4444536f141fb81
We also create folder for persistent storage of the Grafana configuration, like a dashboards. We also expose the port “3000”, on which Grafana is available. Also we run the Docker container with Grafana using “–user root”, not a default one.
The next step is create certificate for Grafana for HTTP access, much as we did it for InfluxDB:
2
3
4
5
6
Generating a RSA private key
............+++++
.................................+++++
writing new private key to '/etc/ssl/grafana-selfsigned.key'
-----
After that we need to update the configuration file of Grafana, but first of all we need to download it from the container:
Then we modify the content of this file to use HTTPS:
2
3
4
5
6
7
8
9
10
11
12
13
##################### Grafana Configuration Example #####################
#
! OUTPUT IS OMITTED
#################################### Server ####################################
[server]
# Protocol (http, https, socket)
protocol = https
! OUTPUT IS OMITTED
# https
cert_file = /etc/ssl/grafana-selfsigned.crt
cert_key = /etc/ssl/grafana-selfsigned.key
! OUTPUT IS OMITTED
Afterwards we copy file back to container and restart it:
2
$ sudo docker container restart 87cb36ac74ea
The entire configuration is done, the container is up and running and we can access it over HTTPS:

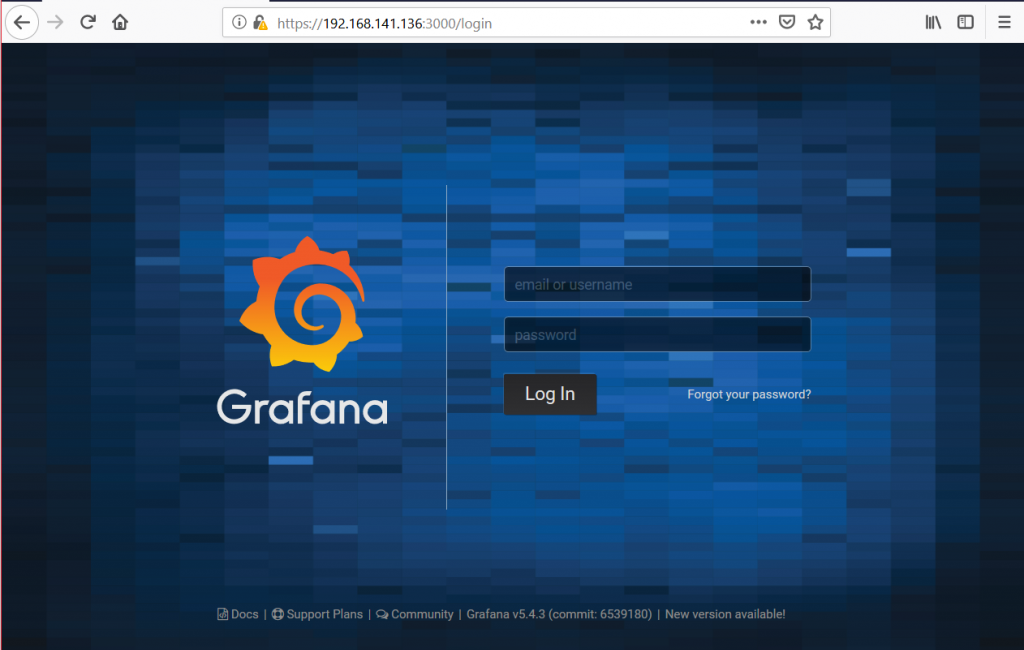
Default credentials is “admin/admin”. When we login, we configure database as InfluxDB with the following parameters:

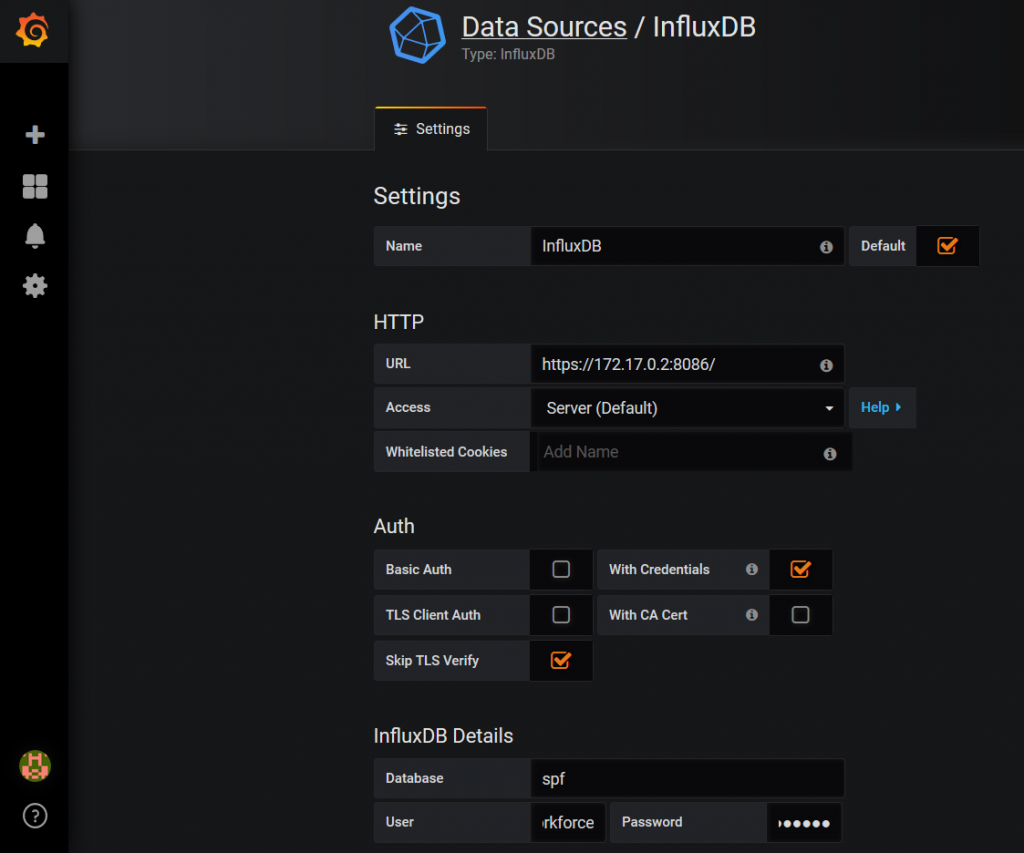
The following parameters are important:
- URL to IP address of InfluxDB “172.17.0.2” to exposed port “8086” over “https”.
- Databse name “spf”.
- InfluxDB credentials “user/password”.
- Authentication with Credentials and skipping TLS verification.
The very last point is to create proper graphs in Grafana to monitor the utilization of the ports:

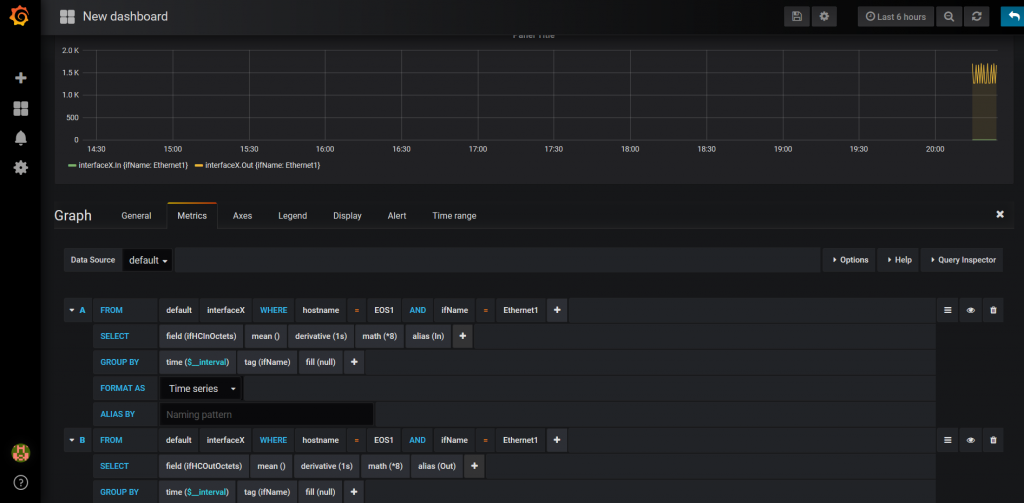
What we need to do is just to create the graphs for each and every interface. Finally, our Service Provider Fabric is monitored.
Automation with Ansible and integration to Service Provider Fabric package
As you might have spotted, there are a lot of different activities we need to perform, like to start/restart containers, copy files and update of configuration files. This is perfect case for automation. That’s why I’ve created proper Ansible playbooks and roles to do it instead of you.
You need to just to pull files from my GitHub and launch proper playbook:
The following tags are available:
- “docker_install” to install Docker and create proper configuration for the first time.
- “docker_ops” to run Docker for 2nd time and later on.
- “tick_install” to install Telegraf, InfluxDB and Grafana and create proper configuration for the first time
- “tick_ops” to run the whole monitoring stack for 2nd time and later on.
The final configuration you can find on my GitHub page.

Lessons learned
The major lessons I learned is that with Docker containers you need to be very preceise and test a lot. The reason for that is that being cross platform, they might behave a bit different. It’s not a problem, as long as you test all the configuration and operation properly in advance. It takes some time to test everything works, but once it’s tested, it will work great work for you. So spend your time on testing all applications running as Docker containers.
Conclusion
Monitoring is very important for each network, especially service provider. Using Telegraf, InfluxDB and Grafana is, in my opinion, proper way forward for monitoring each and every network, because they are great open-source tools. I strongly believe, that Open-source tools are future. Moreover, the monitoring and telemetry is first step towards closed-loop automation. But this is topic for another discussion.
Take care and good bye!
Support us
P.S.
If you have further questions or you need help with your networks, I’m happy to assist you, just send me message. Also don’t forget to share the article on your social media, if you like it.
BR,
Anton Karneliuk