


Hello my friend,
in the previous blogpost we’ve started the discussion how you can improve your customers’ experience in your network via better observability of the network health with Prometheus by means of periodic automated speedtest and iperf3 measurements. Albeit it is very important and useful, it doesn’t tell you if the customers’ or your own resources are available. By resource we mean any exposed service, such as web page, streaming service, etc. Today you will learn how to setup a monitoring with Docekrised Prometheus to make sure that you know for sure if the services are available for customers.
2
3
4
5
retrieval system, or transmitted in any form or by any
means, electronic, mechanical or photocopying, recording,
or otherwise, for commercial purposes without the
prior permission of the author.
Why to Automate Monitoring?
Monitoring allows to make you aware, what is the state of resources you are interested in. At a bare minimum, you shall be notified if the state of resources deviates from the acceptable value and, therefore, crosses some threshold. At the same time, this is just the first step. The end goal is self-healing systems, where outages of different components don’t affect the service as a whole via automated configuration changes to restore the service. And this is why you need to know, how the automation works.
And we are keen to assist you with learning the automation skills!
We offer the following training programs:
- Zero-to-Hero Network Automation Training
- High-scale automation with Nornir
- Ansible Automation Orchestration with Ansble Tower / AWX
During these trainings you will learn the following topics:
- Success and failure strategies to build the automation tools.
- Principles of software developments and tools for that.
- Data encoding (free-text, XML, JSON, YAML, Protobuf)
- Model-driven network automation with YANG, NETCONF, RESTCONF, GNMI.
- Full configuration templating with Jinja2 based on the source of truth (NetBox).
- Best programming languages (Python, Bash) for developing automation, configuration management tools (Ansible) and automation frameworks (Nornir).
- Network automation infrastructure (Linux, Linux networking, KVM, Docker).
- Orchestration of automation workflows with AWX and its integration with NetBox, GitHub, as well as custom execution environments for better scalability.
Moreover, we put all mentions technologies in the context of real use cases, which our team has solved and are solving in various projects in the service providers, enterprise and data centre networks and systems across the Europe and USA. That gives you opportunity to ask questions to understand the solutions in-depts and have discussions about your own projects. And on top of that, each technology is provided with online demos and labs to master your skills thoroughly. Such a mixture creates a unique learning environment, which all students value so much. Join us and unleash your potential.
Brief Description
In the previous blogpost about monitoring with Prometheus we have discussed a use case, where we are hosting resources in public data centres and are willing to know, what is the performance of the network connectivity between our cloud locations and what is the bandwidth of the internet connectivity there. Today we will take a look at our public resources from a different angle. Namely, we’ll try to measure the user experience. As this phrase is quite a vague, let’s clarify what exactly we mean. We will test:
- Whether the server (VM, container) hosting our service is available over the Internet?
- Whether the service the server is running is working (i.e., we can make a request to application and receive a response)?
- How quickly do we get a response?
- Whether we can download the specific content in full and we can assure that? How long does it take?
- Whether the service is available via its FQDN and this name can be resolved publicly?
Obviously, the list of application’s availability metrics can be much longer, but we believe that this list is a good starting point and it can be used to validate the health of almost all web-based services.
All the mentioned metrics make sense, if they are measured from outside of the location, where the service is hosted. Moreover, from different geographical areas we’ll have different results, which can be input for a further planning, if we want to optimise the application delivery worldwide and improve the customer experience. Let’s see how can we can measure that.
Use Case
For today’s lab, we’ll use the following scenario. We have three web services we are willing to monitor:
- Karneliuk blog hosted at https://karneliuk.com
- GitHub service hosted at https://github.com
- OpenStack webpage hosted at https://www.openstack.org
For these web services we want to monitor the following parameters:
- Availability of the underlying server(s) hosting the applications using ICMP including a measurement of the RTT.
- Availability of the applications themselves using HTTP GET including a measurement of the load interval.
- Resolution of FQDN at the desired DNS servers and the response time.
- Availability a certain content in full via downloading it (HTTP GET again) and looking for a specific match using regex. That also includes the measurement of time needed to download the content.
Solution Description
The good thing is that folks from Prometheus thought about such a use case and created a corresponding exported, which is called the blackbox exporter. What a strange name… or not?
Originally Prometheus is created for a purpose of monitoring your infrastructure, so that you have access to the monitored device, install an exporter there and scrape the data. However, in the described scenario it doesn’t matter. From the end user perspective, the services are provided by some “black boxes”, which are existing somewhere far away and end user doesn’t have a management access to them and can only consume a specific application running on a specific port. Hence, the name.
Read the first blogpost about Prometheus to get up to speed with the terminology.
Let’s visualise, how our monitoring setup is going to look like today.

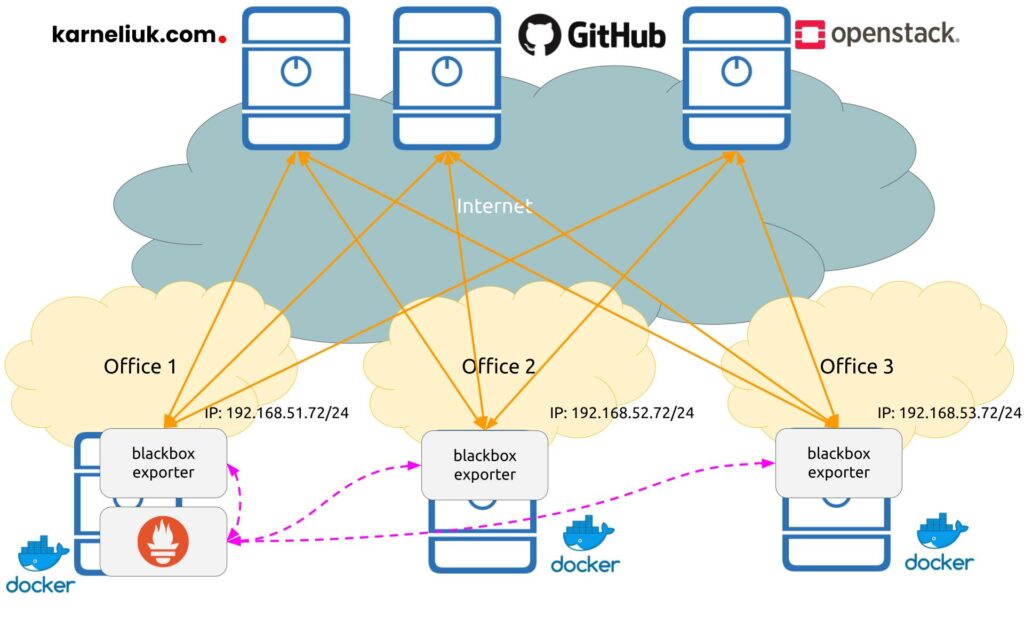
In the same way as in the previous blogpost, Prometheus and exporters are deployed as Docker containers, which significantly simplifies the operational overhead. Also in terms of communication:
- Orange solid lines show the monitoring flows between Prometheus blackbox exporters and the monitored targets.
- Dashed violet lines show the control plane flows between Prometheus backend and Prometheus blackbox exporters.
Enrol to our Zero-to-Hero Network Automation Training to learn how to use Docker and create your own containerised automation.
Implementation Details
It is assumed you have read the previous blogpost and completed steps provided in it.
Step #1. Hosts with Exporters
In contrast to the exporters from the previous blogpost, this time it is needed to do some configuration on the exporter side itself. The way how the blackbox exporter works:
- On the Prometheus blackbox exporter side you define types of the checks available for the Prometheus (e.g., HTTP GET, ICMP, etc) and define their parameters.
- On the Prometheus side within the job config you define targets, which you are willing to monitor using the checks defined above.
Step #1.1. Blackbox Exporter Configuration File
To implement the monitoring of aforementioned KPIs, you would need to create the following configuration file on the Prometheus blackbox exporter side:
2
3
4
5
6
7
8
9
10
11
12
13
14
15
16
17
18
19
20
21
22
23
24
25
26
27
---
modules:
http_2xx:
prober: http
timeout: 10s
http:
icmp_test:
prober: icmp
timeout: 10s
icmp:
preferred_ip_protocol: ip4
payload_size: 64
dns_test:
prober: dns
timeout: 10s
dns:
query_name: karneliuk.com
preferred_ip_protocol: ip4
ip_protocol_fallback: false
http_parsing:
prober: http
timeout: 10s
http:
fail_if_body_not_matches_regexp:
- ".*</html>"
...
The following logic is applied here:
- Within the dictionary modules, you create the probe options, which has a name (e.g., http_2xx) and variables of the probe.
- These options specify type of the probe, the timeout of scrapping and the probe-specific parameters:
- It can be no extra parameters like in http_2xx.
- For ICMP we specify the protocol we want to use (both IPv4 and IPv6 options are available) as well as the payload size.
- For DNS we specify, which FQDN we want to resolve as well as the version of IP in the same was as in ICMP.
- For the content availability, we specify which regex shall the body match to qualify a condition of success. In this case we are looking for the closing HTML tag.
The full list of configuration options is provided in the official documentation for the Prometheus blackbox exporter.
Step #1.2. Blackbox Exporter Docker-compose File
The second step in the Prometheus blackbox exporter setup is the docker-compose file, which launches Docker container(s) with the exporters. You can run one big container with all types of checks, or choose a micro-services approach, with each check conducted by a separate Docker container. As such, the docker-compose file looks like as follows;
2
3
4
5
6
7
8
9
10
11
12
13
14
15
16
17
18
19
20
21
22
23
24
25
26
27
28
29
30
31
32
33
34
35
36
37
---
version: "3.9"
services:
blackbox_http:
image: "prom/blackbox-exporter:master"
ports:
- "9115:9115"
volumes:
- "./config:/config"
command:
- "--config.file=/config/blackbox.yaml"
blackbox_icmp:
image: "prom/blackbox-exporter:master"
ports:
- "9116:9115"
volumes:
- "./config:/config"
command:
- "--config.file=/config/blackbox.yaml"
blackbox_dns:
image: "prom/blackbox-exporter:master"
ports:
- "9117:9115"
volumes:
- "./config:/config"
command:
- "--config.file=/config/blackbox.yaml"
blackbox_http_parser:
image: "prom/blackbox-exporter:master"
ports:
- "9118:9115"
volumes:
- "./config:/config"
command:
- "--config.file=/config/blackbox.yaml"
...
As you can see, we create 4 identical containers with a single parameter changing:
- public port on which the Prometheus will reach the blackbox exporter.
We can just generate public port automatically and simplify the content of the docker-compose file; however, this will require us to change the configuration on the Prometheus side at each restart, which is not a desirable setup. All the rest parameters of all 4 Docker containers are the same.
Step #1.3. Launch Prometheus Blackbox Exporter
Once the configuration file and docker-compose files are created, launch the exporter side:
2
3
4
5
6
7
8
9
10
11
12
13
14
Creating network "web-monitoring_default" with the default driver
Pulling blackbox_http (prom/blackbox-exporter:master)...
master: Pulling from prom/blackbox-exporter
554879bb3004: Pull complete
9ec611452210: Pull complete
c17bd3230a15: Pull complete
57f96573daa0: Pull complete
Digest: sha256:1f01186d9bd9f8b090a730079a9912d0ae022d768c377d9dca62310682dc178e
Status: Downloaded newer image for prom/blackbox-exporter:master
Creating web-monitoring_blackbox_http_parser_1 ... done
Creating web-monitoring_blackbox_icmp_1 ... done
Creating web-monitoring_blackbox_dns_1 ... done
Creating web-monitoring_blackbox_http_1 ... done
Once launched, validate that containers are up and running:
2
3
4
5
6
CONTAINER ID IMAGE COMMAND CREATED STATUS PORTS NAMES
629fe9a51a24 prom/blackbox-exporter:master "/bin/blackbox_expor…" 40 minutes ago Up 40 minutes 0.0.0.0:9115->9115/tcp, :::9115->9115/tcp web-monitoring_blackbox_http_1
6cdf474c2ef3 prom/blackbox-exporter:master "/bin/blackbox_expor…" 40 minutes ago Up 40 minutes 0.0.0.0:9117->9115/tcp, :::9117->9115/tcp web-monitoring_blackbox_dns_1
0a5055b92fea prom/blackbox-exporter:master "/bin/blackbox_expor…" 40 minutes ago Up 40 minutes 0.0.0.0:9118->9115/tcp, :::9118->9115/tcp web-monitoring_blackbox_http_parser_1
7fd2c7a4af9a prom/blackbox-exporter:master "/bin/blackbox_expor…" 40 minutes ago Up 40 minutes 0.0.0.0:9116->9115/tcp, :::9116->9115/tcp web-monitoring_blackbox_icmp_1
Step #2. Host with Prometheus
The setup of the Prometheus side doesn’t change:
- You need to have a configuration file, which describes jobs need to be done (i.e., what shall be monitored and how often).
- You need to have a docker-compose file, which will launch the Prometheus itself.
Refer to the previous blogpost for further details.
Step #2.1. Prometheus Configuration File
As described earlier, we would need to have job for each exporter. In the provided scenario, there are 3 exporters, so you would need to have jobs for each of them. Moreover, as there were multiple Docker container created to serve each type of probes, there will be 4 probes per a blackbox exporter. It means that in total you would have 4 * 3 = 12 jobs.
You can downscale it back to 6 by combining ICMP, HTTP, and HTTP with parsing into a single one. DNS still will be outstanding, as it has a different mechanics.
The following Prometheus configuration file is used to implement the aforementioned scenario:
2
3
4
5
6
7
8
9
10
11
12
13
14
15
16
17
18
19
20
21
22
23
24
25
26
27
28
29
30
31
32
33
34
35
36
37
38
39
40
41
42
43
44
45
46
47
48
49
50
51
52
53
54
55
56
57
58
59
60
61
62
63
64
65
66
67
68
69
70
71
72
73
74
75
76
77
78
79
80
81
82
83
84
85
86
87
88
89
90
91
92
93
94
95
96
97
98
99
100
101
102
103
104
105
106
107
108
109
110
111
112
113
114
115
116
117
118
119
120
121
122
123
124
125
126
127
128
129
130
131
132
133
134
135
136
137
138
139
140
141
142
143
144
145
146
147
148
149
150
151
152
153
154
155
156
157
158
159
160
161
162
163
164
165
166
167
168
169
170
171
172
173
174
175
176
177
178
179
180
181
182
183
184
185
186
187
188
189
190
191
192
---
global:
scrape_interval: 1m
scrape_timeout: 30s
scrape_configs:
# blackbox tests
- job_name: 'blackbox-probe-http-1'
metrics_path: /probe
params:
module: [http_2xx]
static_configs:
- targets:
- https://karneliuk.com
- https://www.openstack.org
- https://github.com
relabel_configs:
- source_labels: [__address__]
target_label: __param_target
- source_labels: [__param_target]
target_label: instance
- target_label: __address__
replacement: 192.168.51.72:9115
- job_name: 'blackbox-probe-http-2'
metrics_path: /probe
params:
module: [http_2xx]
static_configs:
- targets:
- https://karneliuk.com
- https://www.openstack.org
- https://github.com
relabel_configs:
- source_labels: [__address__]
target_label: __param_target
- source_labels: [__param_target]
target_label: instance
- target_label: __address__
replacement: 192.168.52.72:9115
- job_name: 'blackbox-probe-http-3'
metrics_path: /probe
params:
module: [http_2xx]
static_configs:
- targets:
- https://karneliuk.com
- https://www.openstack.org
- https://github.com
relabel_configs:
- source_labels: [__address__]
target_label: __param_target
- source_labels: [__param_target]
target_label: instance
- target_label: __address__
replacement: 192.168.53.72:9115
- job_name: 'blackbox-probe-icmp-1'
metrics_path: /probe
params:
module: [icmp_test]
static_configs:
- targets:
- karneliuk.com
- www.openstack.org
- github.com
relabel_configs:
- source_labels: [__address__]
target_label: __param_target
- source_labels: [__param_target]
target_label: instance
- target_label: __address__
replacement: 192.168.51.72:9116
- job_name: 'blackbox-probe-icmp-2'
metrics_path: /probe
params:
module: [icmp_test]
static_configs:
- targets:
- karneliuk.com
- www.openstack.org
- github.com
relabel_configs:
- source_labels: [__address__]
target_label: __param_target
- source_labels: [__param_target]
target_label: instance
- target_label: __address__
replacement: 192.168.52.72:9116
- job_name: 'blackbox-probe-icmp-3'
metrics_path: /probe
params:
module: [icmp_test]
static_configs:
- targets:
- karneliuk.com
- www.openstack.org
- github.com
relabel_configs:
- source_labels: [__address__]
target_label: __param_target
- source_labels: [__param_target]
target_label: instance
- target_label: __address__
replacement: 192.168.53.72:9116
- job_name: 'blackbox-probe-dns-1'
metrics_path: /probe
params:
module: [dns_test]
static_configs:
- targets:
- 8.8.8.8
- 9.9.9.9
relabel_configs:
- source_labels: [__address__]
target_label: __param_target
- source_labels: [__param_target]
target_label: instance
- target_label: __address__
replacement: 192.168.51.72:9117
- job_name: 'blackbox-probe-dns-2'
metrics_path: /probe
params:
module: [dns_test]
static_configs:
- targets:
- 8.8.8.8
- 9.9.9.9
relabel_configs:
- source_labels: [__address__]
target_label: __param_target
- source_labels: [__param_target]
target_label: instance
- target_label: __address__
replacement: 192.168.52.72:9117
- job_name: 'blackbox-probe-dns-3'
metrics_path: /probe
params:
module: [dns_test]
static_configs:
- targets:
- 8.8.8.8
- 9.9.9.9
relabel_configs:
- source_labels: [__address__]
target_label: __param_target
- source_labels: [__param_target]
target_label: instance
- target_label: __address__
replacement: 192.168.53.72:9117
- job_name: 'blackbox-probe-http-parser-1'
metrics_path: /probe
params:
module: [http_parsing]
static_configs:
- targets:
- https://karneliuk.com
relabel_configs:
- source_labels: [__address__]
target_label: __param_target
- source_labels: [__param_target]
target_label: instance
- target_label: __address__
replacement: 192.168.51.72:9118
- job_name: 'blackbox-probe-http-parser-2'
metrics_path: /probe
params:
module: [http_parsing]
static_configs:
- targets:
- https://karneliuk.com
relabel_configs:
- source_labels: [__address__]
target_label: __param_target
- source_labels: [__param_target]
target_label: instance
- target_label: __address__
replacement: 192.168.52.72:9118
- job_name: 'blackbox-probe-http-parser-3'
metrics_path: /probe
params:
module: [http_parsing]
static_configs:
- targets:
- https://karneliuk.com
relabel_configs:
- source_labels: [__address__]
target_label: __param_target
- source_labels: [__param_target]
target_label: instance
- target_label: __address__
replacement: 192.168.53.72:9118
...
For each of the jobs:
- The static_targets needs to be specified containing resources to be monitored:
- For ICMP, HTTP, and HTTP with Parsing, this is FQDNs of the monitored resources
- For DNS , it would be IP addresses of DNS servers, which you would resolved the desired FQDN against.
- Also it is needed to specify for each job the probe type in a module field.
- As well as the probe address address in the relabel_configs part.
This was the most complicated part in the Prometheus configuration. Finally, you need to launch the container.
Step #2.2. Prometheus Docker-compose File
This file isn’t changed since the previous blogpost:
2
3
4
5
6
7
8
9
10
11
12
13
14
---
version: "3.9"
services:
prom:
image: "prom/prometheus"
ports:
- "9090:9090"
volumes:
- "./config:/etc/prometheus"
- "tsdb_persistent:/prometheus"
volumes:
tsdb_persistent:
...
Step #2.3. Launch Prometheus
Using docker-compose, launch the instance of Prometheus:
2
3
4
Creating network "prometheus_default" with the default driver
Creating volume "prometheus_tsdb_persistent" with default driver
Creating prometheus_prom_1 ... done
Validate the newly created Docker container with Prometheus is up and running:
2
3
CONTAINER ID IMAGE COMMAND CREATED STATUS PORTS NAMES
e778afb49974 prom/prometheus "/bin/prometheus --c…" 2 hours ago Up 59 minutes 0.0.0.0:9090->9090/tcp, :::9090->9090/tcp prometheus_prom_1
Let some time (5-10 minutes) for metrics to be scrapped before progressing further.
Validation
First of all, check that the proves are up in the “Status” -> “Targets” tab:

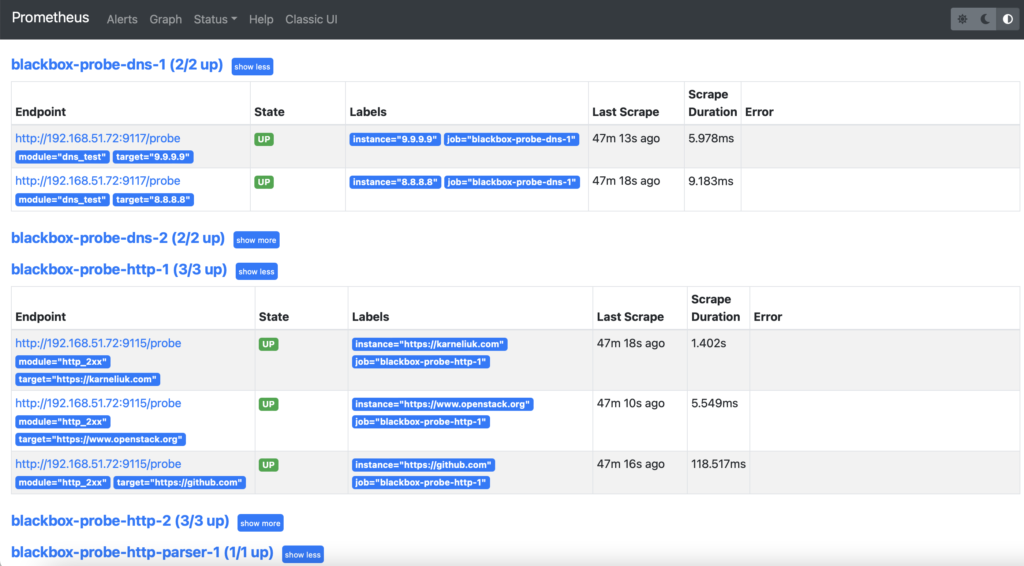
You would see the long list of probes. If they are up, this is a desired state and it is good. However, if they are down, then you would need to troubleshoot it (e.g., network connectivity, status of Docker container, firewall rules, correctness of the probes’ configuration, etc).
Next, navigate to “Graph” tab and choosing the “Graph” visualisation, start looking for the needed metrics:
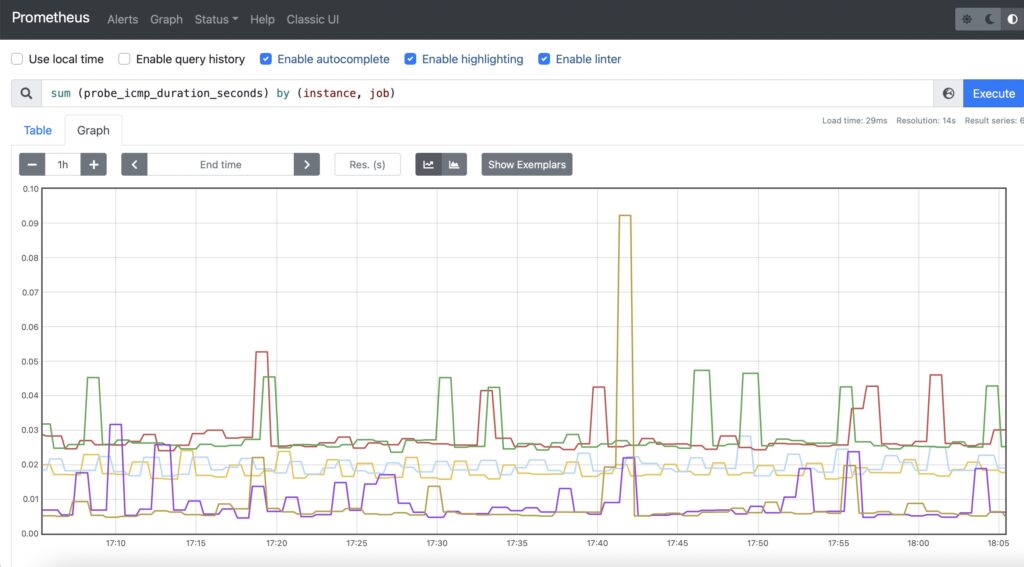
Step #1. Reachability of Servers
For this use case, it is recommended to use ICMP provided the ICMP is not filtered on the server. You can use the probe_icmp_duration_seconds metric, which effectively contains the RTT of the ping together with the processing delay on the probe side. As we are collecting the metric from the different nodes, we need to aggregate the data to simplify the view per instance (monitored site), but yet per exporter node:

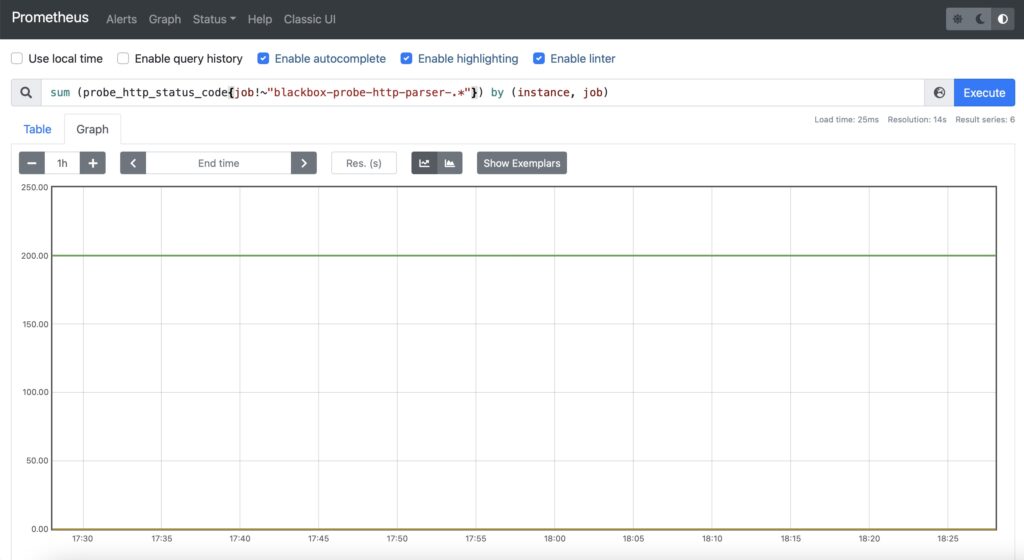
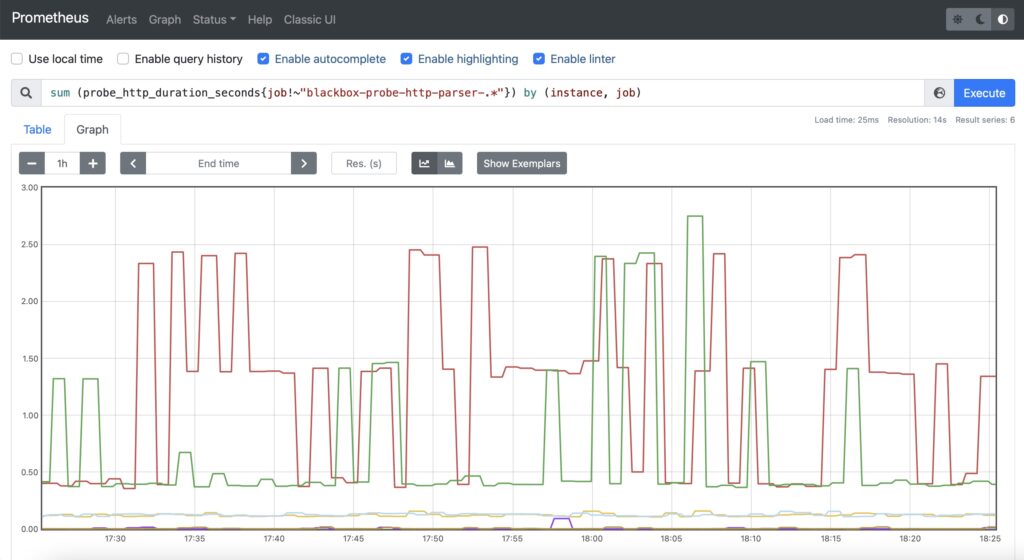
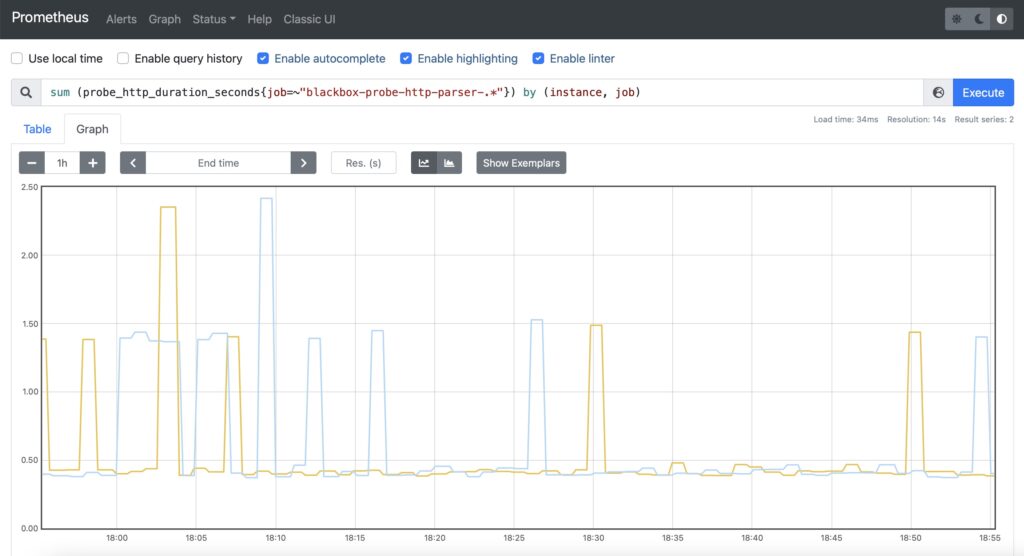
Step #2. Availability of the Web Service
For this case, it is recommended to use two metrics:
- HTTP response code (probe_http_status_code)
- HTTP response time (probe_http_duration_seconds)
The first one will allow you to see, if the service is OK resulting in HTTP 200 response code, whereas the second one will show how quickly the user will get the response for the service.
However, this time, you would need to select the probes, which makes a simple HTTP GET without parsing. Therefore, in addition to aggregation of the time, you would need also add a filtering by the job name, which will exclude specific jobs:

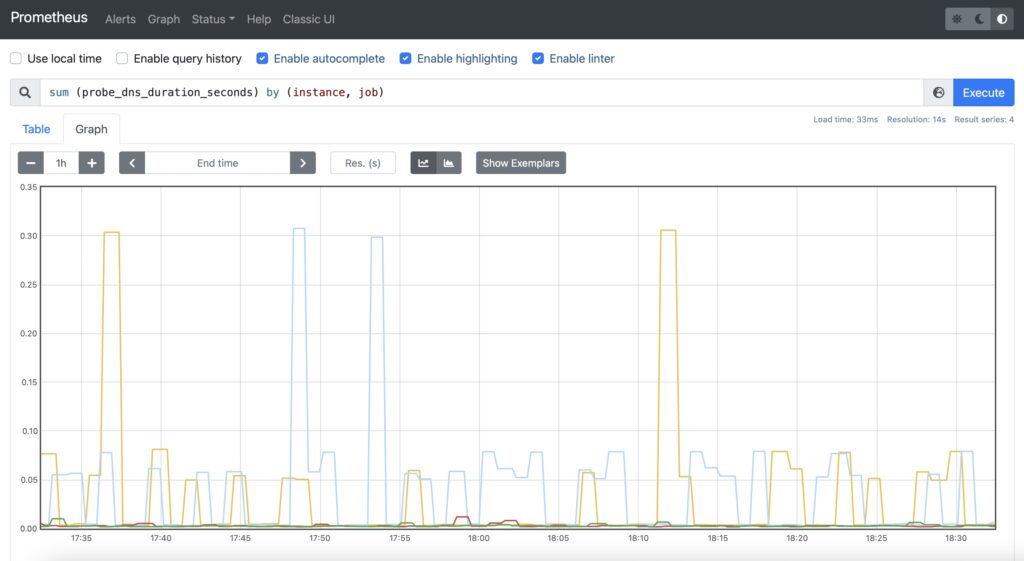
Step #3. Resolution of FQDN
For DNS, it is recommended to use probe_dns_duration_seconds to asses how long does it take to make a resolution:

Step #4. Availability of Specific Content
The setup is the same as for the availability of the web services in step #2 with a single difference: filtering by job name is now inverted.

Examples in GitHub
You can find this and other examples in our GitHub repository.
Lessons Learned
The were two key lessons learned for us:
- First of all, the Prometheus query language was quite a discover. It is very flexible and, therefore, allows to select and/or aggregate the needed information without changing a setup of monitoring jobs.
- The second important one is the granularity of the measurements. For example, the probe_http_duration_seconds consist of five phases: resolve, connect, processing, transfer, tls. Such a granularity allows to validate in-depth, to which degree each of them contributes to the overall service latency.
Conclusion
Prometheus provides a great capabilities for monitoring of user experience of publicly available services (e.g., web pages, e-commerce platforms, etc). The central management of the monitoring solution via a configuration file at Prometheus node reduces the operational expenses quite significantly, which together with Docker-based implementation of a backend and exporters makes the maintenance of the platform manageable even for small teams. In the upcoming blogpost about Prometheus, we’ll touch an example of creating your own exporter. Take care and good bye.
Need Help? Contract Us
If you need a trusted and experienced partner to automate your network and IT infrastructure, get in touch with us.
P.S.
If you have further questions or you need help with your networks, we are happy to assist you, just send us a message. Also don’t forget to share the article on your social media, if you like it.
BR,
Anton Karneliuk