Hello my friend,
In this article I want to explain very interesting and useful tool, which helps you to assess the real performance of the project. It’s called EVM (earned value management). Though it looks a little bit difficult at the first glance, but I’m sure you’ll love it. Personally I like it, because it has math on the background, which for me means that it’s possible to calculate some KPIs rather than guessing them.
Why do I do it now?
Recently I’ve passed CAPM certification by PMI, what is really important achievement for me. But it doesn’t mean that I want to stop my articles and further development in project management sphere. For the upcoming year I have clear goal to achieve PMP credentials, if I manage to get enough experience to satisfy the requirements.
Project’s performance
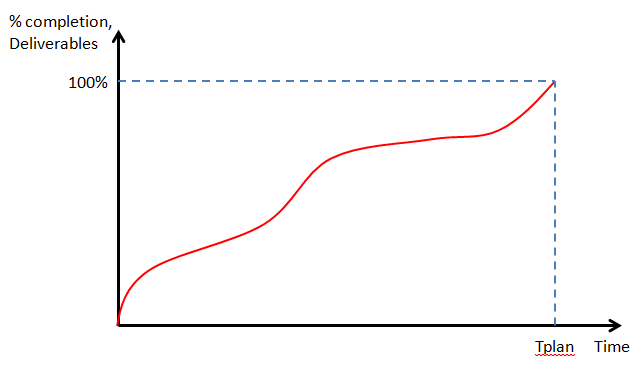
When the initial planning of the project is done and the team has started to produce the deliverables, one of the most important tasks of project manager is tracking the performance of these activities. Tracking is necessary for two main goals. The first one is to keep the project within the schedule and scope now, whereas the second goal is to predict how the project will be being done in future. Such assessment allows you to inform stakeholders early about possible issues with the project and/or take necessary preventive/corrective steps to improve the performance to fit the schedule. In the worst case you will be aware of the necessity to extend schedule or increase the budget. What is really important, you’ll have some kind of calculated figures, which is much more reliable than guesses and assumptions alone.
How does EVM work?
Unfortunately EVM isn’t spread a lot. Personally I was not aware about this system, before I’ve started my preparation for CAPM. In the “A User’s Manual to the PMBOK Guide” it’s said that EVM is typically used at the complex project (in governmental, military or big enterprise fields). Basically you need some time to get this system working, but if the planning processes are done well (meaning that you have realistic scope baseline, schedule baseline and cost baseline) it’s not so difficult.
So, what is earned value management? It’s system which measures the actual project’s performance against schedule baseline and cost baseline. There are three main figures, which are used as input for all the calculations:
- PV (planned value) is amount of work planned to be done at the certain date. It’s calculated as a total sum of all expenses (like materials, labor hours, payments for contractors and etc) according to the baselines at a certain date.
- EV (earned value) is real amount of performed work at the certain date. It’s calculated as a sum of completed deliverables (finished activities is also possible) according to the baselines in money expression.
- AC (actual costs) is real amount of all expenses done at the certain date. It’s calculated as a sum of all money you have really spent till the time of report.
It might looks difficult at the first glance, don’t worry. The following example will help you to understand these things better. Let’s say you have a project, in which you are making the renovation of your flat. Your scope baseline is pretty simple and includes the renovation in each room, and actually it’s your first level deliverables:

Then you define activities for each deliverable and estimate their durations and necessary resources. As primary tools you are going to use expert judgment based on your own experience and market research for material prices. For each deliverable you make such planning. Let’s consider the sleeping room for instance (the template table I’ve taken from “A User’s Manual to the PMBOK Guide “):
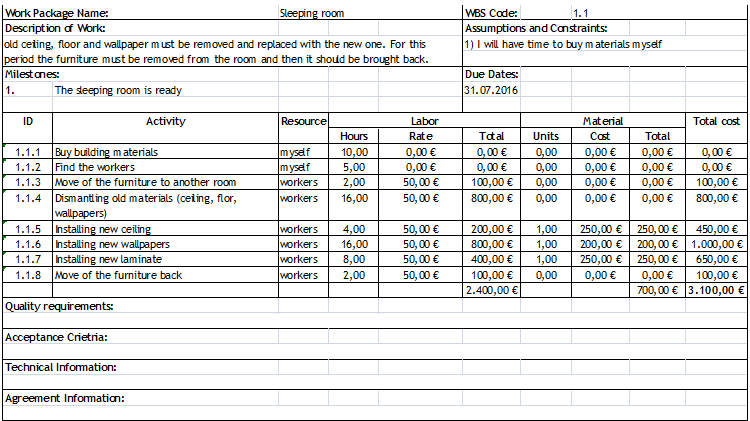
The same list of activities you make for the rest of deliverables. Let’s say that each room has the same amount of work to do in terms of materials and time, so the overall budget is 12.400 Euro. Fur sure in reality it isn’t so but for simplicity let’s use this assumption.
The next assumption is that there will be two workers, who will make renovation work in your flat. Each worker works 8 hours per day, and yourself you can spend up to 8 hours per day on this project as well. We won’t use any of schedule compression techniques as fast tracking or schedule crashing. So all activities are done in a sequenced manner, and all the deliverables are also done one after another. Based on the table above you have 15 hours of work to do per week, and the workers have 48 hours of work. It means that each worker will work 3 full days per week at your project (48 / 2 / 8 = 3), and yourself you also will almost 2 full days a week.
Bringing all these calculations together you should have one room done every week, whereas the whole project takes 4 weeks and 12.400 Euro to be done.
Now let’s connect this numbers with the earned value management (EVM). Money for each activity is our PV. The total sum of all PVs across the project, which are actually the budget, is also called BAC (Budget at completion).
You start doing the project. During performing the dismantling of old materials (activity 1.1.4) it turned out that the workers had to spend much more time than it was planned (20 hours instead of 16). It led to the two main outcomes: there is an additional 200 Euro (4 * 50 Euro) spent the project and activities 1.1.7 and 1.1.8 aren’t accomplished at the 1st week, though activity 1.1.7 is partially (75%) done. Moreover the prices for laminate were higher (materials for activity 1.1.7), because there were some problems with logistics in the shop and you had to buy more expensive one, what led to additional 100 Euro expenses (350 Euro instead of 250).
Based on EVM logic, only completed deliverables or activities are calculated in EV, whereas for AC calculation we use all the money, we have actually paid. The table below brings together all the figures:
| ID | PV | EV | AC |
| 1.1.1 | 0 | 0 | 0 |
| 1.1.2 | 0 | 0 | 0 |
| 1.1.3 | 100 | 100 | 100 |
| 1.1.4 | 800 | 800 | 1000 (20 * 50) |
| 1.1.5 | 450 | 450 | 450 |
| 1.1.6 | 1000 | 1000 | 1000 |
| 1.1.7 | 650 | 487,5 (650 * 75%) | 750 |
| 1.1.8 | 100 | 0 | 100 |
| Total for 1.1 | 3100 | 2837,5 | 3400 |
This example may be is not 100% correct, because activity 1.1.1 and 1.1.2 don’t have any planned values; because it’s assumed that you do it yourself so you don’t spend money. In general all the activities and therefore deliverables must have certain values.
What gives EVM us?
Now it’s time to do some math exercises. Above we have provided description of main earned value management inputs: PV, EV and AC. These values are used to calculate certain EVM KPIs:
- SV (schedule variance) is calculated as difference of EV to PV (SV = EV – PV). If it’s positive then we are ahead of schedule, meaning we are performing well. If it’s negative then we are behind of schedule, so we won’t achieve the project in time.
- SPI (schedule performance indicator) is calculated as relation of EV to PV (SPI = EV/PV). If it’s above 1,0 then we are performing better than planned in terms of accomplished tasks, so the trend is that we’ll finish the project earlier. If SPI is below 1,0 then we are performing worse than planned also in terms of accomplished tasks.
- CV (cost variance) is calculated as difference of EV to AC (CV = EV – AC). It shows how much work we have done comparing to the amount of money we have spent in this work. The logic is same as for SV.
- CPI (cost performance indicator) is calculated as relation of EV to AC (CPI = EV/AC). In simple words it shows how efficiently we spend our money. If CPI is above 1,0 then we have created more value then we have spent the funds. If it is below 1,0 then we are spending more than we create. The baseline is 1,0 obviously.
These KPIs allow you to have good understanding about the health of the project in general. And actually not only to you but also to all stakeholders, because it’s much easier to understand these figures then tons of bar charts and so on.
So for our project we have the following KPIs:
- SV = 2837,5 – 3100 = -262,5 (we are behind the schedule)
- SPI = 2837,5 / 3100 = 0,915 (in terms of accomplished tasks we are performing slower than planned)
- CV = 2837,5 – 3400 = -562,5 (we have over budget)
- SPI = 2837,5 / 3400 = 0,835 (in terms of money usage we are spending more than the value we create)
Well, these figures show that our project is going not very well. We have both negative SV and CV and performance indicators SPI and CPI are below the 1,0.
Everybody likes predictions
But the most marvelous thing, which is offered to you by EVM, is that it allows you to predict the needed budget as well as the probability of completion based on the current performance. For these tasks there two more KPIs:
- EAC (estimate at completion) is a budget, which you have to allocate based on current situation. There are three main formulas, which cover three main scenarios:
- The best case: EAC = AC + BAC – EV. It assumes that starting from now the performance (both SPI and CPI) will be 1,0, which means it must be according to the baseline.
- The most probable case: EAC = AC + (BAC-EV)/CPI. It assumes that the rest of the work will be done with the same CPI, but with SPI 1,0.
- The worst case: EAC = AC + (BAC-EV)/(CPI*SPI). It assumes that the rest of the work will be done with just the same performance.
- TCPI (to complete performance indicator) shows you the necessary CPI that must be achieved in order to accomplish the project to the initial budget (BAC) or newly predicted budget (EAC). That’s why it has also two possible formulas:
- If you have to accomplish the project to BAC: TCPI = (BAC-EV)/(BAC-AC)
- If you can accomplish the project to the EAC: TCPI = (BAC-EV)/(EAC-AC)
The logic for TCPI is the following: If it’s above 1,0, it’s more difficult to complete the project because you need to perform better then baseline; if it’s below 1,0, it’s easier to complete the project because you can perform worse them baseline.
Let’s calculate the future for our project. Just to remind you, our BAC is 12.400 Euro. The EAC can be:
- The best case: EAC = 3400 + (12400 – 2837,5) = 12962,5 Euro
- The most probable case: EAC =3400 + (12400 – 2837,5)/0,835 = 14852,1 Euro
- The worst case: EAC = 3400 + (12400 – 2837,5)/(0,835*0,915) = 15915,95 Euro
For these values you can apply then three point estimation technique (triangular or PERT) to obtain the most probable value:
- Triangular: EAC = (12962,5 + 14852,1 + 15915,95) / 3 = 14576,85 Euro
- PERT: EAC = (12962,5 + 4*14852,1 + 15915,95) / 6 = 14714,475 Euro
Let’s say that you use PERT formula, so after all your calculation your EAC is 14714,475 Euro. It’s more than 2000 Euro overbudget comparing to the BAC. You should either find additional funds for your project or think about buying less expensive materials or doing part of the activities yourself (like moving the furniture for instance).
The last part of our article is the calculation of TCPI:
- If you still want to finish the project to BAC, it must be: TCPI = (12400-2837,5)/(12400-3400) = 1,0625. So you need to produce a value of 1,0625 Euro on 1 Euro spent.
- If you accept the overbudget and want to finish the project to EAC: TCPI = (12400-2837,5)/(14714,475 -3400) = 0,845. So your performance can be quite low and you can spend more money than value you are producing.
As always with the predictions, it’s just the prediction. It has a valuable effect on planning the further work, like searching for less expensive materials (for example) in order to stay within BAC; but it doesn’t mean that you will definitely achieve this overbudget.
Lessons learned
To understand EVM well it’s better to calculate some cases. It has worked good for me, because I’ve started to understand, what these figures means and how they influence the project and stakeholders.
Conclusion
Earned value management is very useful tool. It’s build in different project management software and even it’s easy to calculate it yourself in any table processor. For sure, if the project is big, the table processor is quite difficult to use, but in overall these values provides you good understanding about the health of your project. In my opinion this approach should be used in all the projects, because the predictions based on math are much more solid than predictions based on just someone’s assessments or guesses.
Support us
BR,
Anton Karneliuk

